


GOLD & CRUDE OIL TALKING POINTS:
- Gold prices rise as soft ISM report cools Fed outlook, hurts yields
- Crude oil prices shrug off risk-off mood as Saudi Arabia hikes costs
- Disappointing US employment data may help gold, hurt crude oil
Gold prices rose as disappointing manufacturing ISM data weighed on bond yields and pushed the priced-in Fed policy outlook (as implied in rate futures) further toward the dovish side of the spectrum. That was understandably supportive for non-interest-bearing assets epitomized by the yellow metal.
Crude oil prices also fell as the slowdown in US factory-sector activity growth stoked global slowdown fears and weighed on cycle-sensitive commodity inputs. The drop was short-lived however, with the WTI benchmark diverging from broader risk aversion amid expectations of a Saudi export price hike.
GOLD MAY EXTEND GAINS AS US JOBS DATA DISAPPOINTS
Looking ahead, all eyes are on US employment data.Nonfarm payrolls are seen rising 184k in December while the jobless rate remains at a five-decade low of 3.7 percent and wage inflation inches back to 3 percent from a nine-year high of 3.1 percent.
US data outcomes have increasingly disappointed relative to forecasts in recent months, hinting that analysts’ models are overstating the economy’s vigor. That opens the door for a downside surprise today. Indeed, leading survey data – Markit’s PMI figures as well as the Fed’s own Beige Book – hint at just that.
Such a result is likely to pressure yields further while markets weigh the possibility that the Fed might even cut rates this year. Indeed, the probability of a reduction now stands at over 75 percent. That bodes well for gold. Crude oil may suffer however as signs of slowing growth undermine the outlook for demand.
Learn what other traders’ gold buy/sell decisions say about the price trend!
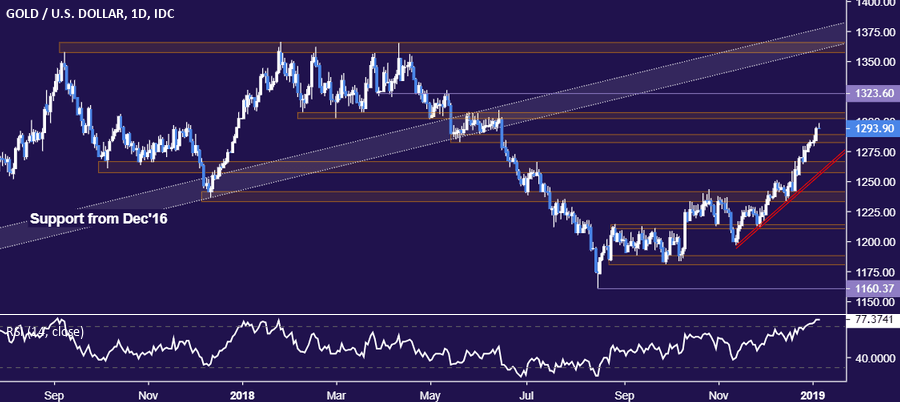
GOLD TECHNICAL ANALYSIS
Gold prices are aiming to test resistance in the 1302.97-07.32 area. A daily close above that exposes minor support-turned-resistance at 1323.60, followed by a major top in the 1357.50-66.06 zone. Alternatively, a move back below former resistance at 1282.27 opens the door for a retest of the 1257.60-66.44 region.
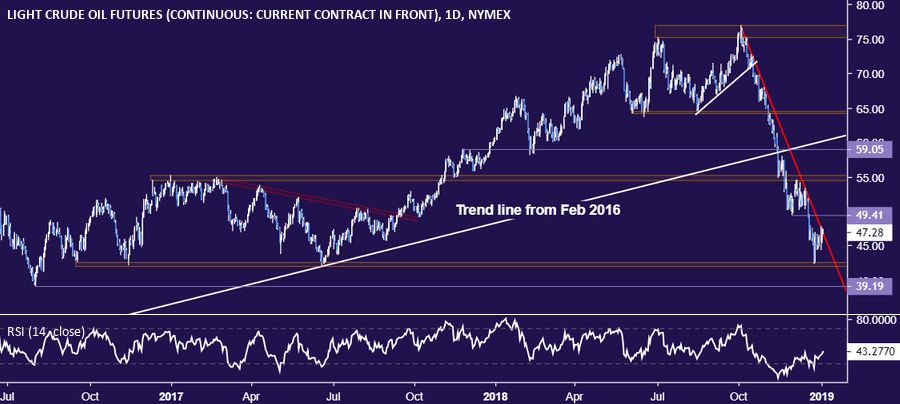
CRUDE OIL TECHNICAL ANALYSIS
Crude oil prices are probing above falling trend line resistance defining the down trend from early October, now at 46.80. Confirmation of a break on a daily closing basis exposes 49.41, the November 29 low. Support is in the 42.05-55 area, with a breach below that targeting the August 2016 bottom at 39.19.
COMMODITY TRADING RESOURCES
- See our guide to learn about the long-term forces driving crude oil prices
- Having trouble with your strategy? Here’s the #1 mistake that traders make
- Join a Trading Q&A webinar to answer your commodity market questions
--- Written by Ilya Spivak, Currency Strategist for DailyFX.com
To contact Ilya, use the comments section below or @IlyaSpivak on Twitter


