


CRUDE OIL & GOLD TALKING POINTS:
- Crude oil prices rise on risk recovery, API inventories report
- Gold prices stall, RSI divergence warns of a downturn ahead
- Hawkish FOMC minutes may broadly weigh on commodities
Crude oil prices rose against the backdrop of improving risk appetite, with the WTI contract tracking the bellwether S&P 500 indexhigher. API inventory flow data offered a further boost. It said stockpiles shed 2.13 million barrels last week, topping forecasts calling for a 909k barrel increase. Gold prices stalled, with traders probably unwilling to commit before minutes from September’s FOMC meeting are released.
CRUDE OIL, GOLD PRICES MAY FALL ON FOMC MINUTES
Last week’s explosive market rout seems to have reflected worries about the pace of Fed interest rate hikes. That appears to have investors betting on a so-called “Powell put” – so named for the current Chair of the rate-setting committee – whereby market instability will force the US central bank to dial back stimulus withdrawal. They may be disappointed.
Indeed, Fed officials including Mr Powell have painstakingly signaled otherwise since the beginning of the year. A hawkish tone in the Minutes document reiterating as much is then likely to bolster tightening bets and boost the US Dollar, which has somewhat uncharacteristically suffered in the risk-off environment. That will probably bode ill for perennially anti-fiat gold prices.
Crude oil may likewise suffer as sentiment sours anew and a resurgent Greenback applies de-facto pressure to assets priced in USD terms on global markets. The downward push may be mitigated to some extent if official EIA inventory data echoes the API forecast however.
See our gold forecast to learn what is likely to drive price action through year-end!
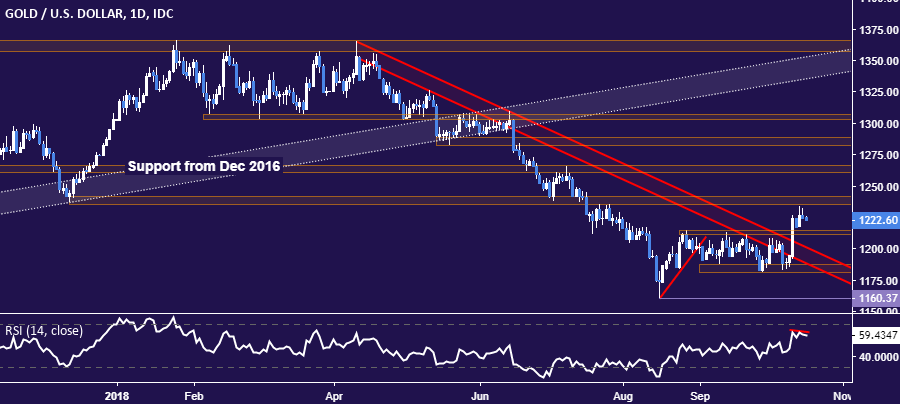
GOLD TECHNICAL ANALYSIS
Gold prices paused to digest gains below resistance in the 1235.24-41.64 area. Negative RSI divergence hints a turn lower may be next, with a push below resistance-turned-supportin the 1211.05-14.30 zone putting the September 28 low at 1180.86 back in focus. Alternatively, a daily close above 1241.64 exposing the 1260.80-66.44 region.
CRUDE OIL TECHNICAL ANALYSIS
Crude oil prices continue to tread water at trend line support set form mid-August, now at 71.21. A daily close below that opens the door for a retest of former resistance in the 70.05-26 area. Alternatively, a push above 78.22 exposes the 75.00-77.31 resistance region (August 2011 – June 2012 lows) once again. Longer-term positioning hints a major top is forming.

COMMODITY TRADING RESOURCES
- See our guide to learn about the long-term forces driving crude oil prices
- Having trouble with your strategy? Here’s the #1 mistake that traders make
- Join a Trading Q&A webinar to answer your commodity market questions
--- Written by Ilya Spivak, Currency Strategist for DailyFX.com
To contact Ilya, use the comments section below or @IlyaSpivak on Twitter


