


Talking Points:
- Wednesday saw the Dow, S&P 500, and NASDAQ drop precipitously, as each shed over 3%
- Dow dropped to lowest level since August 24th, suffering the largest intraday drop since February
- Rising bond yields have weighed market sentiment for many investors, partially spurring the sell-off
US equity markets took a huge hit Wednesday, shedding months of gains in a single session as a risk-off attitude gripped markets. The S&P 500 shed over 90 points, falling -3.24% to 2,786. The Dow Jones Industrial Average dropped 830 points down -3.14% to 25,598, the lowest since August 24th. Leading the dive, the NASDAQ surrendered 315 points falling -4.08% to 7,422.
See how our clients are positioned on different assets and currency pairs with IG Client Sentiment.
US Equity Price Chart October

Chart prepared by John Kicklighter
The S&P 500 closed at a level last seen on July 12th, forfeiting nearly three months of gains. Critically, the index dipped below its 100-day moving average but remains above the 200DMA.
View a more in-depth technical view of Wednesday’s rout here.
S&P 500 Price Chart Hourly, May - October

While industrials and blue chips dropped sharply, they fell short of the NASDAQ's descent. The QQQ ETF which tracks the NASDAQ suffered its worst day since June 2016. Similarly FAANG, a source of considerable growth and jubilation in the recent stages of the decade-long bull run, also faltered today.
FAANG Price Chart Daily, May 2017 – October 2018
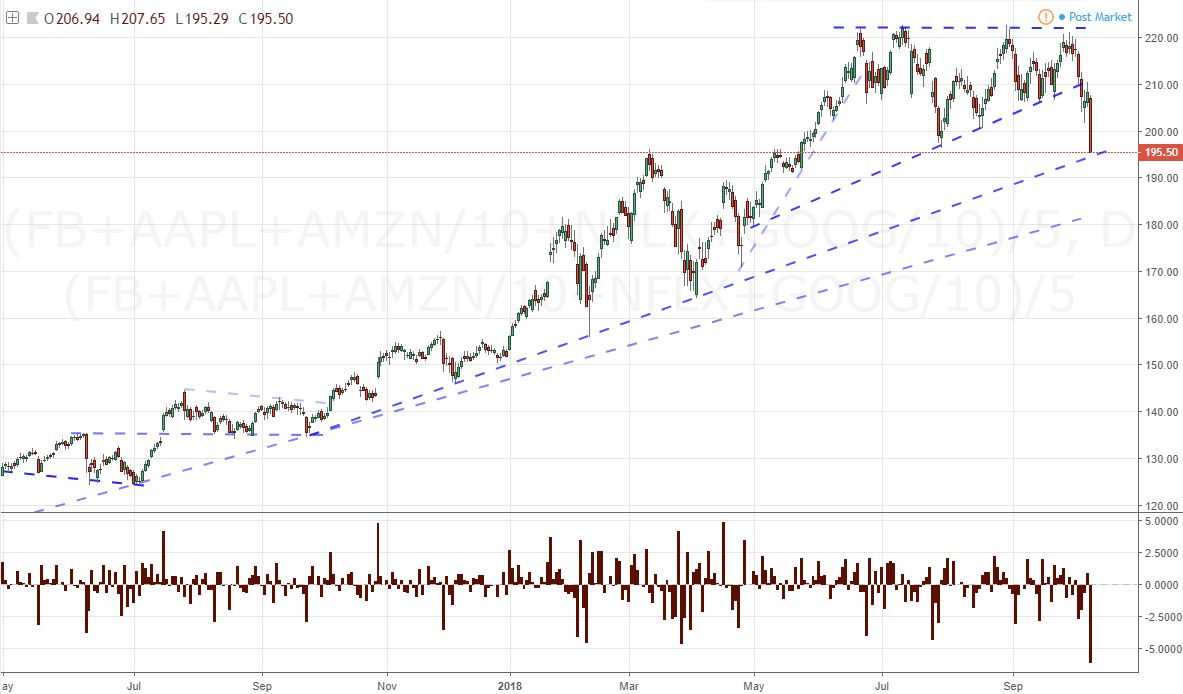
Chart prepared by John Kicklighter
Wednesday also marked the first 1 percent or greater loss in the S&P 500 in a single trading day in 75 trading periods, ending the third longest period in a twelve year span.

Chart prepared by John Kicklighter
October as a whole has been tumultuous for US equities as rising bond yields, typically a bullish sign for stocks, have weighed on investor sentiment. After nearly a decade of record low interest rates, speculators are beginning to worry the bull-run is running on fumes as we approach a higher interest rate environment. With higher interest, firms will face lower profit margins and weigh on quarterly earnings.
Read A Brief History of Trade Wars to catch up on the ongoing economic conflict and how it may weigh on markets.
Further, the world's two largest economies remain locked in a trade war. The economic conflict will continue to weigh on sentiment and contribute uncertainty to global growth until resolved.
S&P 500 Price Chart 5-Minute, October 10th

As we look to enter Thursday’s session, it is important to note the sell-off steepened just before the close, suggesting Thursday may be another rough day for investors with equity exposure. Look to the upcoming Asia session to gauge global sentiment and conviction for a continued rout.
--Written by Peter Hanks, Junior Analyst for DailyFX.com
Contact and follow Peter on Twitter @PeterHanksFX
Other Top Stories:
US Dollar Snaps Both Haven & Yield Bid. Slides with Bonds & Stocks – By Christopher Vecchio, Senior Currency Strategist
Dow Reversal Gains Speed, Tests Below 26k: Are Bulls Done? – By James Stanley, Currency Strategist
EUR/JPY Weekly Technical Outlook– Price Reversal Eyes Initial Support – By Michael Boutros, Currency Strategist
DailyFX forecasts on a variety of currencies such as the US Dollar or the Euro are available from the DailyFX Trading Guides page. If you’re looking to improve your trading approach, check out Traits of Successful Traders. And if you’re looking for an introductory primer to the Forex market, check out our New to FX Guide.


