


GOLD & CRUDE OIL TALKING POINTS:
- Gold prices fall as dovish ECB translates into stronger US Dollar
- Crude oil prices edge up on inventory data, Saudi shipment halt
- US GDP data might keep gold under pressure, oil impact unclear
Gold prices turned lower as the US Dollar returned to the offensive, tarnishing the appeal of anti-fiat alternatives. An early retracement of the prior day’s downswing was compounded by a dovish ECB policy announcement, which sank EUR/USD and echoed as broader support for the greenback (as expected).
Meanwhile, crude oil prices continued to edge higher, finding continued support in an impressive set of EIA inventory figures. News that Saudi Arabia suspended shipments through the Bab el-Mandeb Strait after Houthi attacks on two of its tankers probably helped as well.
GOLD PRICES VULNERABLE AS US GDP DATA BOOSTS DOLLAR
The spotlight now turns to US GDP data. Economists expect to see that the annualized growth rate ticked up to 4.2 percent in the second quarter, the highest in almost four years. A strong result may boost bets on a fourth Fed rate hike in 2018. Its probability is now priced in at 57.8 percent.
The US Dollar is likely to extend gains in this scenario, weighing on gold prices. The likely response from crude oil is clouded however. A pickup in growth bodes well for cycle-sensitive commodities but USD strength applies de-facto downside pressure. Time will tell which catalyst proves to be more potent.
Learn what other traders’ gold buy/sell decisions say about the price trend!
GOLD TECHNICAL ANALYSIS
Gold prices remain locked in a narrow range above the 38.2% Fibonacci expansionat 1217.29. A daily close below this boundary exposes the 50% levelat 1202.28. Alternatively, a move above support-turned-resistance at 1236.66 targets the 1260.80-66.44 area.

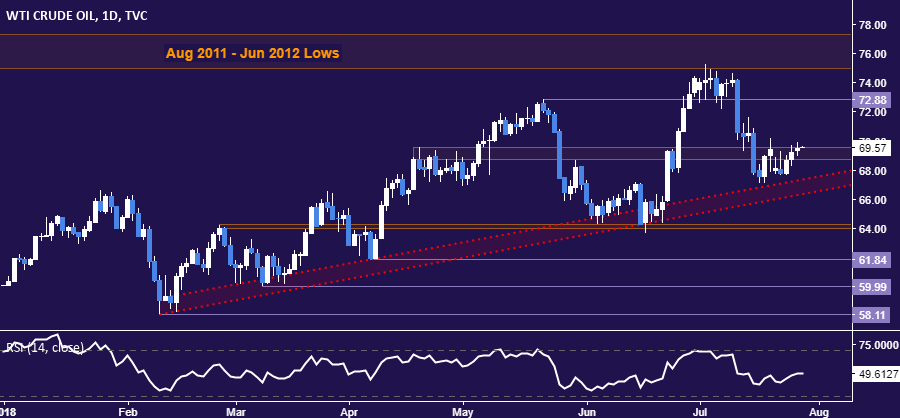
CRUDE OIL TECHNICAL ANALYSIS
Crude oil prices continue to tread water above trend support established in early February. A daily close below its outer layer – now at 66.31 – opens the door for a challenge of the 63.96-64.26 area. Alternatively, a push through resistance in the 68.74-69.53 zone paves the way for a test above the $72/bbl figure.
COMMODITY TRADING RESOURCES
- See our guide to learn about the long-term forces driving crude oil prices
- Having trouble with your strategy? Here’s the #1 mistake that traders make
- Join a Trading Q&A webinar to answer your commodity market questions
--- Written by Ilya Spivak, Currency Strategist for DailyFX.com
To contact Ilya, use the comments section below or @IlyaSpivak on Twitter


