


CRUDE OIL & GOLD TALKING POINTS:
- Crude oil prices rise to four-year high on US/China de-escalation
- Technical setup still hints at topping, API inventory data in focus
- Gold prices precariously cling to trend support, but for how long?
Crude oil prices rose as the markets’ mood brightened amid signs of de-escalation in US/China trade tensions, as expected. Interestingly, gold prices also rose as the exuberant mood translated into a weaker US Dollar. Commodity-linked and emerging market currencies geared to the global business cycle soared against the greenback, echoing as an overall down move. That understandably lifted the go-to anti-fiat asset.
GOLD MAY RETREAT AS FOMC MINUTES LOOM, OIL EYES API DATA
Looking ahead, investors’ initial exuberance may cool absent specifics of a lasting US/China accord. In turn, this may allow Fed policy speculation to reclaim its perch as the central concern for financial markets before minutes from the May 2 FOMC meeting cross the wires Wednesday. That might discourage overexposure to short-USD positions and send the greenback higher amid profit-taking, pressuring gold prices.
As for crude oil, they will be looking to the weekly APIinventory flow report. The outcome will be judged relative to expectations calling for 2.06 million barrel drawdown to be reported in official EIA statistics due Wednesday. A larger outflow may boost prices while a smaller one – or even a surprise build – might pressure them downward. A resurgent US Dollar is likely to be a headwind either way.
See our quarterly crude oil price forecast to learn what will drive the trend through mid-year!
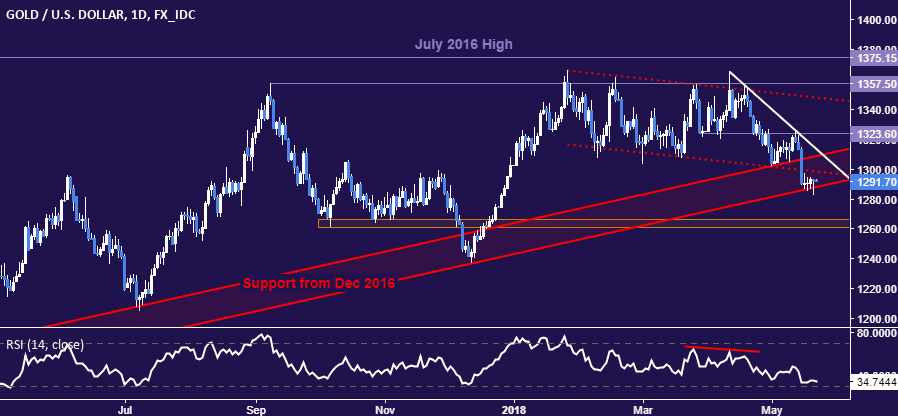
GOLD TECHNICAL ANALYSIS
Gold prices remain stuck at the outer layer of support guiding the rising trend from December 2016, now at 1287.94. A daily close below that sees the next downside threshold in the 1260.80-66.44 area. Alternatively, a turn back above channel floor support-turned-resistance at 1298.52 targets a falling trend line at 1312.84.
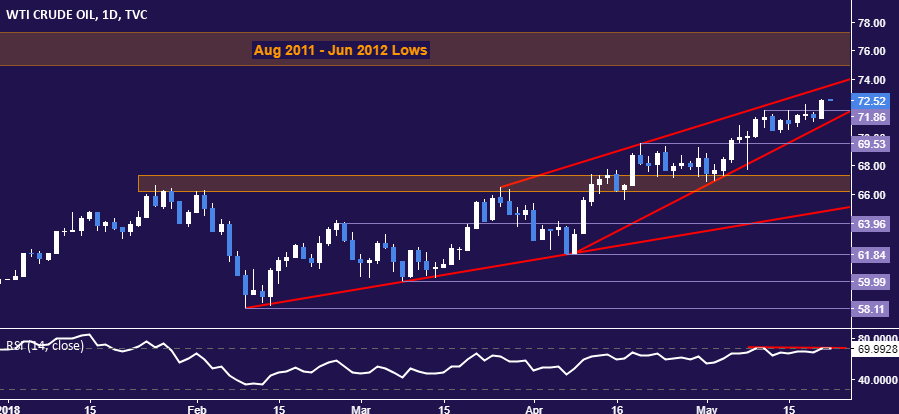
CRUDE OIL TECHNICAL ANALYSIS
Crude oil prices breached resistance at 71.86, the May 10 high, exposing a rising wedge top at 73.64. Negative RSI divergence continues to warn of an incoming turn lower. A reversal back below 71.86 and breach of wedge floor support at 71.18 opens the door for a retest of the April 19 high at 69.53.
COMMODITY TRADING RESOURCES
- See our guide to learn about the long-term forces driving crude oil prices
- Having trouble with your strategy? Here’s the #1 mistake that traders make
- Join a Trading Q&A webinar to answer your commodity market questions
--- Written by Ilya Spivak, Currency Strategist for DailyFX.com
To contact Ilya, use the comments section below or @IlyaSpivak on Twitter


