GOLD & CRUDE OIL TALKING POINTS:
- Gold prices bounce from key support amid US Dollar pullback
- Crude oil price rise restrained on Saudi oil minister comments
- Commodities may consolidate amid lull in top-tier news flow
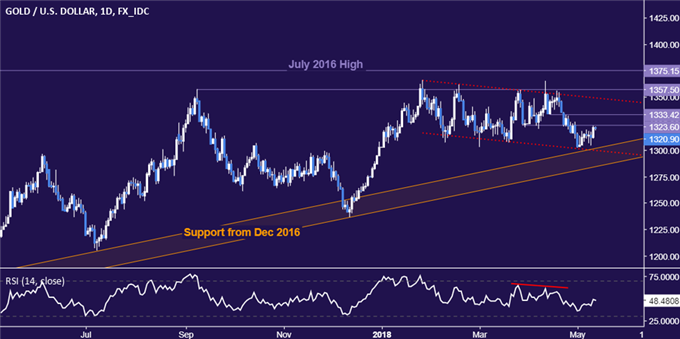
Gold prices traded higher as the US Dollar pulled back from a four-month high against its major counterparts, boosting the relative appeal of anti-fiat and non-interest-bearing assets epitomized by the yellow metal. April’s slightly disappointing US CPI data offered the move acceleration. It put the core inflation rate at 2.1 percent, short of analysts’ expectations.
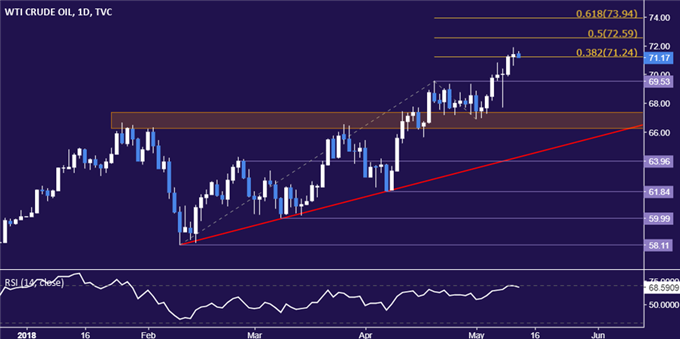
Crude oil prices were restrained however after Saudi energy minister Khalid Al-Falih pledged market stability after the US withdrawal from a nuclear disarmament deal with Iran, which is likely to bring the re-imposition of sanctions. To that end, Al-Falih said he is in close contact with officials from OPEC, Russia and the US as well as other major producers and consumers.
FUTURES POSITIONING, RIG COUNT DATA DUE
Looking ahead, a dull offering on the economic calendar leaves commodities without a readily identifiable catalyst. Futures speculative positioning data from the ICE and CFTC as well as Baker Hughes rig count figures are on tap, but they are rarely market-moving. S&P 500 futures also point to a neutral risk appetite setting. On balance, this hints at consolidation through the week-end.
See our quarterly gold price forecast to learn what will drive the trend through mid-year!
GOLD TECHNICAL ANALYSIS
Gold prices are attempting to carve out a bottom after testing rising trend support set from December 2016. From here, a push through minor barriers in the 1323.60-33.42 area opens the door for a challenge of resistance defining the broadly bearish bias since the beginning of the year. This is marked by a channel ceiling and a double top in the 1349.40-57.50 zone. Trend support now stands in the 1284.20-1302.68 region.

CRUDE OIL TECHNICAL ANALYSIS
Crude oil prices narrowly breached the 38.2% Fibonacci expansionat 71.24, seemingly paving the way for a test of the 50% level at 72.59. A further push beyond that eyes the 61.8% Fib at 73.94. A daily close back below 71.24 would invalidate the break and put resistance-turned-support marked by the April 19 high at 69.53 back in focus.

COMMODITY TRADING RESOURCES
- See our guide to learn about the long-term forces driving crude oil prices
- Having trouble with your strategy? Here’s the #1 mistake that traders make
- Join a Trading Q&A webinar to answer your commodity market questions
--- Written by Ilya Spivak, Currency Strategist for DailyFX.com
To contact Ilya, use the comments section below or @IlyaSpivak on Twitter


