


Talking Points:
- Gold prices reverse from resistance as the US Dollar recovers
- Crude oil price chart hints a double top is forming near $66/bbl
- Sentiment trends compete with US GDP, EIA data for influence
The US Dollar recovered yesterday in a move that seemingly reflected a reevaluation of what ebbing trade and shooting war fears mean for Fed rate hike prospects.That undermined demand for anti-fiat alternatives and weighed on gold prices.
The greenback’s gains applied de-facto pressure to crude oil prices as well, which are denominated in terms of the benchmark currency on global markets. The lion’s share of the losses came later in the day however as stocks turned sharply lower, pulling the cycle-sensitive WTI contract down along the way.
Looking ahead, a revised set of fourth-quarter US GDP numbers is expected to bring an upside revision, lifting the annualized growth rate to 2.7 percent from the prior estimate of 2.5 percent. This will compete with risk trends for influence over gold prices, where stock index futures are hinting at “risk-off” mood.
A larger-than-expected upgrade might boost Fed rate hike bets, hurting gold. US data outcomes have stabilized relative to forecasts recently however, so this seems unlikely. The metal may regain some of its appeal if risk aversion weighs on bond yields, though the advance might be limited if haven flows boost USD.
Meanwhile, crude oil eyes official EIA inventory flow data after API estimated that stockpiles added 5.32 million barrels last week. Median forecasts see a much smaller gain of just 146.4k barrels. An outcome closer to API’s call will probably send prices lower. Risk aversion might compound selling pressure.
Learn what retail traders’ gold buy and sell decisions say about the price trend!
GOLD TECHNICAL ANALYSIS
Gold prices put in a Bearish Engulfing candlestick pattern on a test of resistance in the 1352.40-54.26 area (trend line, 38.2%Fibonacci expansion), hinting a turn lower may be ahead. A daily close below support at 1333.51, the 23.6% level, exposes the recent range bottom support at 1307.25. Alternatively, a breach of resistance sees the next upside barrier in the 1366.06-67.67 zone (January 25 high, 50% level).

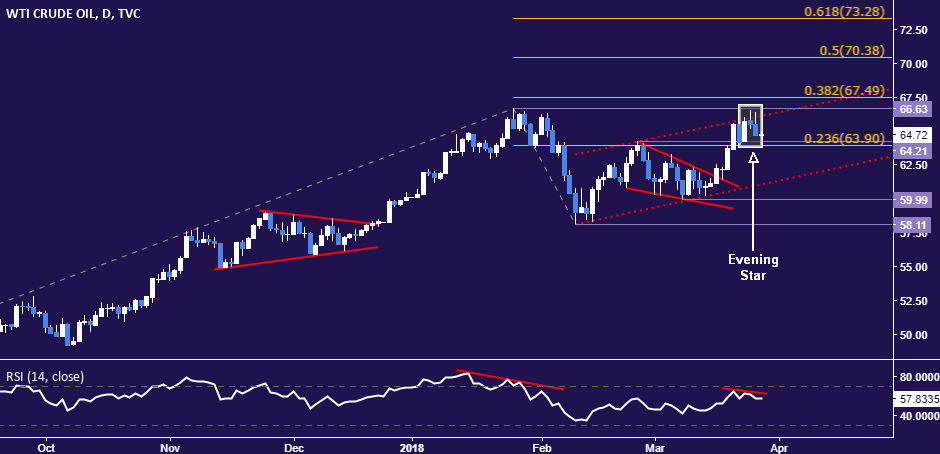
CRUDE OIL TECHNICAL ANALYSIS
Crude oil prices turned lower as expected, producing a bearish Evening Star candlestick to hint a double top may be in the works. A daily close below the 23.6%Fibonacci expansion at 63.90 exposes channel support at 61.09, followed by the $60/bbl figure. Alternatively, break above 66.63-67.49 area (January 25 high, 38.2% level) targets the 50% Fib at 70.38.
COMMODITY TRADING RESOURCES
- See our guide to learn about the long-term forces driving crude oil prices
- Having trouble with your strategy? Here’s the #1 mistake that traders make
- Join a Trading Q&A webinar to answer your commodity market questions
--- Written by Ilya Spivak, Currency Strategist for DailyFX.com
To contact Ilya, use the comments section below or @IlyaSpivak on Twitter
To receive Ilya's analysis directly via email, please SIGN UP HERE


