


Talking Points:
- Gold prices rise as US Dollar selling resumes after gov’t shutdown ends
- Crude oil prices push upward after major US refiner files for bankruptcy
- Find out here what clues retail traders’ bets offer about gold price trends
Gold prices rose as lawmakers reached a deal ending the US government shutdown. The stopgap measure will allow for full operations to resume through February 8. The disruption amounted to just one working day, which is probably not enough to meaningfully derail US or global growth momentum. That breathed new life into the “reach for yield” narrative and hurt the US Dollar, boosting the yellow metal by extension.
Crude oil prices saw a burst of seesaw volatility that ultimately took the WTI benchmark higher on news that Philadelphia Energy Solutions LLC, responsible for over a quarter of refining capacity on the east coast of the US, has filed for bankruptcy. The spotlight now turns to weekly API inventory flow statistics, which will be judged against bets on a 1.02 million barrel drop to be reported in official data Wednesday.
Check out our guide to learn what are the long-term forces driving crude oil prices !
GOLD TECHNICAL ANALYSIS – Gold prices are attempting a cautious recovery but a move beyond recent ranges remains elusive. A break above the 38.2% Fibonacci expansion at 1342.49 exposes 1353.03 (trend line, 50% level). Alternatively, a turn below resistance-turned-support at 1325.96 (January 4 high) opens the door for a test of the 1303.32-08.38 area (38.2% Fib retracement, January 10 low).
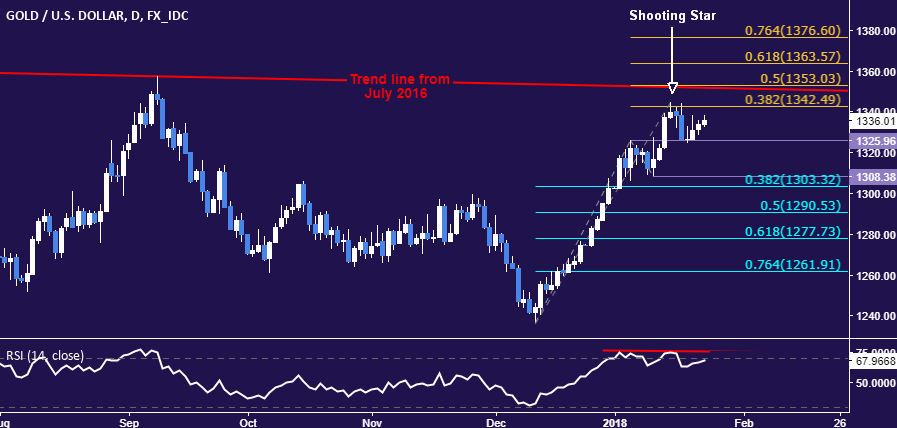
Chart created using TradingView
CRUDE OIL TECHNICAL ANALYSIS – Crude oil prices are struggling to make good on a bearish Evening Star candlestick pattern, treading water above the 23.6% Fibonacci retracement at 62.80. A daily close below this barrier initially exposes the 38.2% level at 61.52. The first layer of key resistance remains at 64.86, the January 15 high.

Chart created using TradingView
--- Written by Ilya Spivak, Currency Strategist for DailyFX.com
To receive Ilya's analysis directly via email, please SIGN UP HERE
Contact and follow Ilya on Twitter: @IlyaSpivak


