


Talking Points:
- Gold prices struggle for direction on US tax cut uncertainty, Yellen to speak
- Crude oil prices look to monthly IEA report, API inventory data for catalyst
- What do retail traders’ bets say about on-coming gold moves? Find out here
Gold prices struggled to find lasting direction, with prices marking time within a now-familiar consolidation range. Speculation about the expected path of Fed monetary policy in 2018 continues to be pivotal. That keeps the prospects for US tax reform – which markets expect will boost inflation and force the FOMC to tighten faster – squarely in the spotlight. An upcoming speech from Fed Chair Yellen may also be noteworthy.
Crude oil prices spiked briefly lower but ultimately failed to find lasting momentum, finishing the day in familiar territory. OPEC predicted a pickup in demand next year while the EIA upgraded its expectation for US shale output in December, offering conflicting directional cues. The IEA monthly report as well as weekly API inventory flow statistics are now in focus. The latter will be judged against expectations of a 2.2 million barrel outflow from US storage last week.
What are the forces driving long-term crude oil price trends? See our free guide to find out!
GOLD TECHNICAL ANALYSIS – Gold prices continue to hover above support at the lower bound of a would-be bearish Triangle chart pattern, now at 1270.75. Breaching that on a daily closing basis exposes the 1260.80-61.50 area (October 6 low, 50% Fibonacci expansion). Alternatively, a push above Triangle resistance at 1294.81 targets 1306.04, the October 16 high.
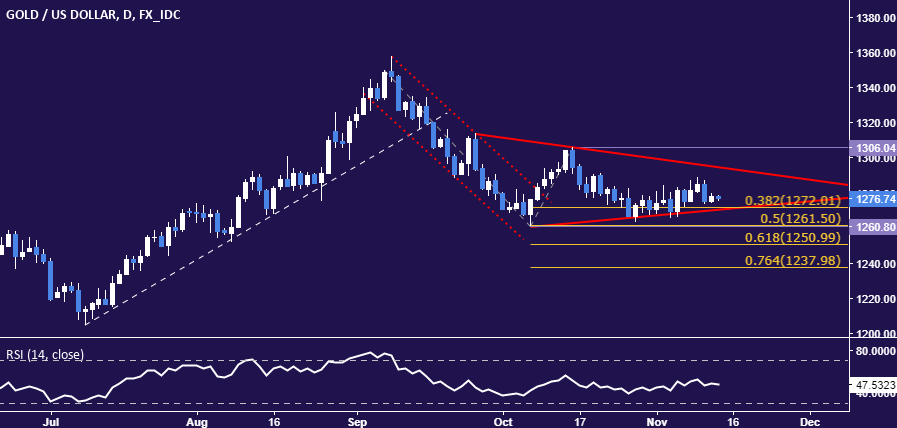
Chart created using TradingView
CRUDE OIL TECHNICAL ANALYSIS – Crude oil prices remain stuck in familiar territory, oscillating below the 38.2% Fibonacci expansion at 57.57. A daily close above this barrier opens the door for a test of the 50% level at 58.71. Alternatively, a reversal below the 23.6% Fib at 56.17 exposes the January 3 highat 55.24 anew.
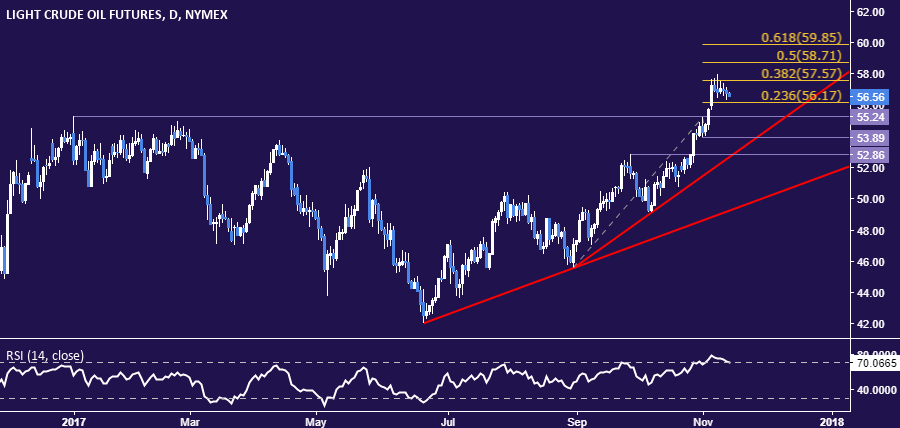
Chart created using TradingView
--- Written by Ilya Spivak, Currency Strategist for DailyFX.com
To receive Ilya's analysis directly via email, please SIGN UP HERE
Contact and follow Ilya on Twitter: @IlyaSpivak


