


Talking Points:
- Gold prices decline as Fed interest rate hike bets continue to build
- Crude oil prices break one-month trend as Fitch sees cap at $60/bbl
- API inventory data in focus for crude oil as gold consolidates losses
Gold prices continued to decline as firming Fed rate hike expectations pushed the US Dollar higher, understandably undermining the appeal of anti-fiat assets. The yellow metal’s latest lurch downward followed a better-than-expected US manufacturing ISM survey, as expected. The report put the pace of factory-sector growth at the fastest since May 2004.
Crude oil prices also suffered, issuing the largest daily drop in a month. Ratings giant Fitch said lower production costs and considerable growth potential for US shale should keep prices below $60/barrel in the long term. Meanwhile, OPEC output reportedly rose by 120k barrels per day in September compared with the prior month. Another shutdown of Libya’s Shahara field – its largest – passed unnoticed.
The weekly API inventory bulletin is now in focus. By way of context, official EIA figures are expected to show stockpiles shed 456.4k barrels last week. Prices may fall if API reports a smaller outflow or a surprise build; they might likewise rebound if a larger draw is reported. Meanwhile, a lull in relevant news-flow may allow gold a bit of time to consolidate losses.
Where are crude oil and gold prices heading in the fourth quarter? See our forecasts here !
GOLD TECHNICAL ANALYSIS – Gold prices continue to edge lower. A break below the 76.4%Fibonacci expansion at 1260.74 confirmed on a daily closing basis would expose the 100% level at 1244.40, a barrier reinforced by a rising trend line set from mid-December 2016. Alternatively, a move back above the 50% Fib at 1279.01 opens the door for a retest of the 1287.18-88.28 area (38.2% expansion, September 21 low).
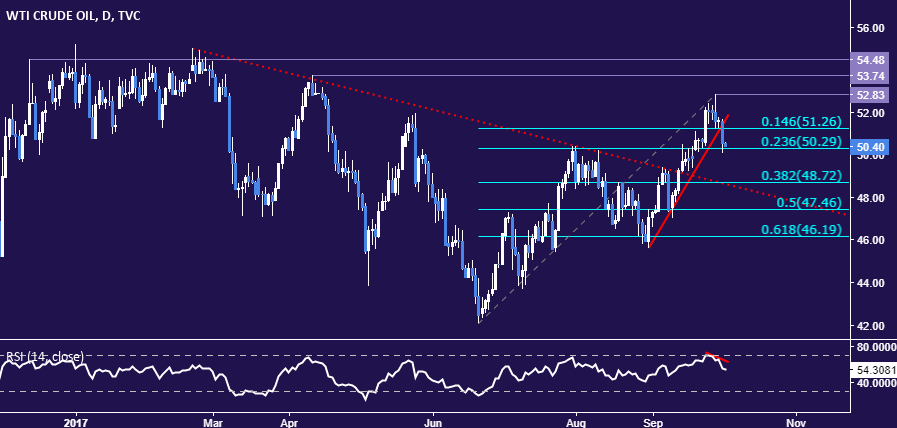
Chart created using TradingView
CRUDE OIL TECHNICAL ANALYSIS – Crude oil prices punched through support at a rising trend line guiding the way higher in September, hinting the near-term bias now favors the downside. From here, a daily close below the 23.6% Fibonacci retracementat 50.29 exposes the 38.2% level at 48.72. Alternatively, a bounce back above the 14.6% Fibat 51.26 clears the way for a retest of the September 28 high at 52.83.
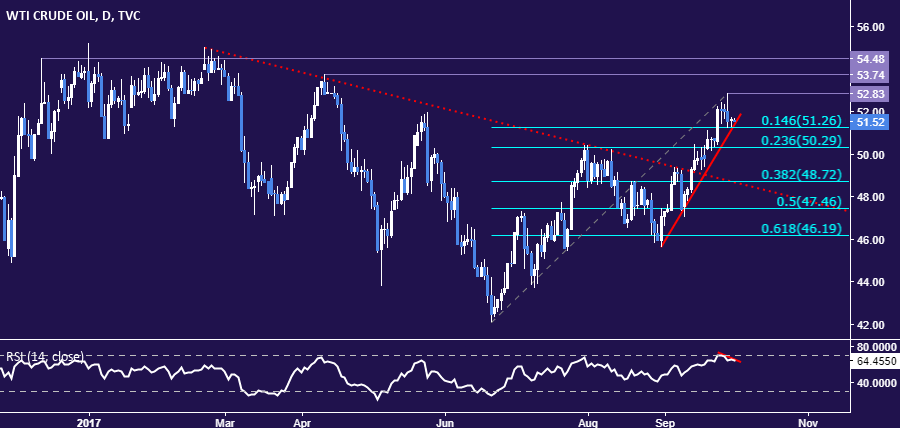
Chart created using TradingView
--- Written by Ilya Spivak, Currency Strategist for DailyFX.com
To receive Ilya's analysis directly via email, please SIGN UP HERE
Contact and follow Ilya on Twitter: @IlyaSpivak


