


Talking Points:
- Crude oil prices break 2-week range floor despite upbeat API data
- Gold prices retreat from 9-month has North Korea worries fizzle
- Revised US Q2 GDP, ADP jobs data may boost Fed rate hike bets
Crude oil prices continued to reckon with the impact of Tropical Storm Harvey. The WTI benchmark initially faced selling pressure amid continued concerns that hurricane-induced refinery shutdowns will undermine efforts to work through a supply glut, echoing yesterday’s price action.
That narrative seemed to change however as amid reports that raw-material producers may respond to lingering pipeline disruptions by reducing output. That seemed to spark an intraday bounce, though this was to be short-lived even as API reported an inventory drawdown of 5.78 million barrels last week.
Official EIA inventory statistics are now on tap, with median forecasts pointing to a more modest 1.9 million barrel outflow. A reading closer in line with API data might offer a degree of support but the markets’ tepid response to that figure seem to hint that Harvey-related developments will remain in focus.
Gold prices retreated after briefly touching the highest level in nine months. The surge followed after North Korea conducted another missile test but the conspicuous absence of “fire and fury” on the part of the US thereafter seemed to calm investors.
This probably puts Fed policy speculation to the forefront for the yellow metal. A revised set of second-quarter US GDP figures and the ADP gauge of private payrolls growth may sent it lower if bets on mild improvements are bested, echoing increasingly upbeat US economic news-flow since mid-June.
What is the #1 mistake that traders make, and how can you fix it? Find out here !
GOLD TECHNICAL ANALYSIS – Gold prices conspicuously failed to confirm a break above the 38.2% Fibonacci expansion at 1311.94 and negative RSI divergence points to ebbing upside momentum, hinting a turn lower may be ahead. Breaking back below resistance-turned-support at 1295.46 exposes the August 25 low at 1275.34. Alternatively, a move back above 1311.94 opens the door for another test of the 50% expansion at 1323.25.
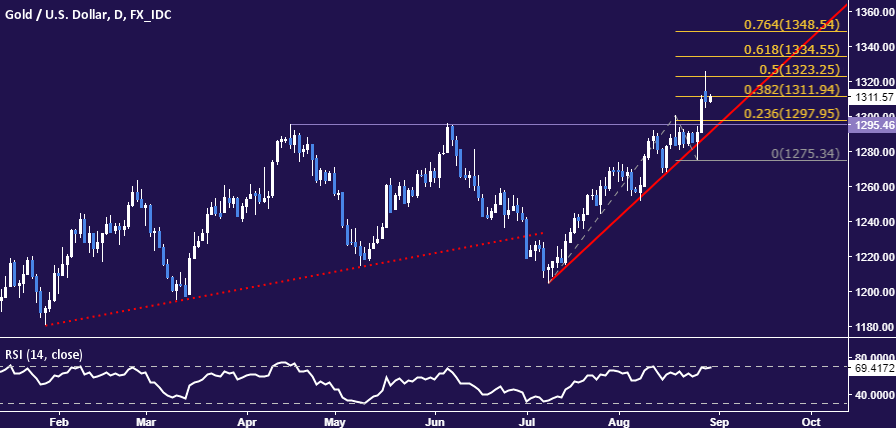
Chart created using TradingView
CRUDE OIL TECHNICAL ANALYSIS – Crude oil prices finally resolved what to do after spending two weeks stuck in a narrow range, breaking through support to expose the 50% Fibonacci expansion at 45.46. A daily close below this barrier sees the next major threshold in the 42.08-84 area (June 21 low, 76.4% level). Alternatively, a move back above the 38.2% Fib at 46.62 targets support-turned-resistance at 48.76 anew.
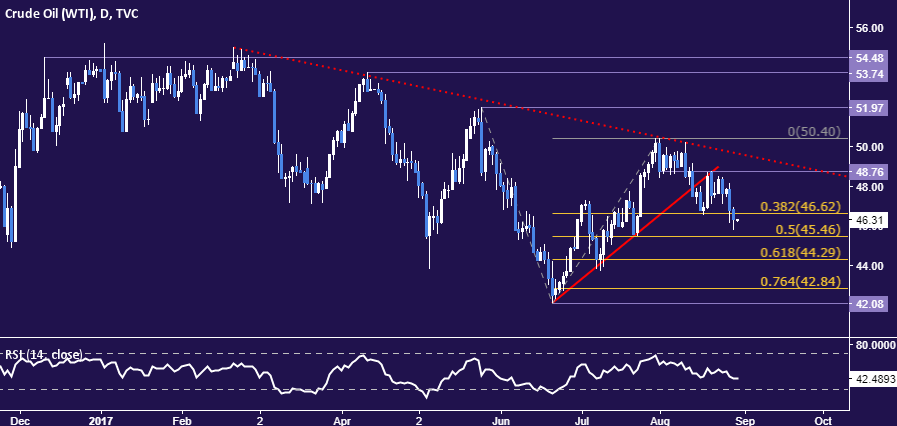
Chart created using TradingView
--- Written by Ilya Spivak, Currency Strategist for DailyFX.com
To receive Ilya's analysis directly via email, please SIGN UP HERE
Contact and follow Ilya on Twitter: @IlyaSpivak


