


Talking Points:
- Gold prices may correct lower amid risk-on trade having surged after FOMC
- Crude oil prices turn earnings reports from industry heavyweights for guidance
- Are commodity prices matching DailyFX forecasts so far in Q3? Find out here
Gold prices surged in the wake of an FOMC announcement that the markets interpreted as dovish. The US Dollar fell alongside Treasury bond yields after the policy statement crossed the wires, boosting the relative appeal of non-interest-bearing and anti-fiat assets.
Looking ahead, a lull in top-tier news flow may see momentum slow until second-quarter US GDP figures enter the picture Friday. S&P 500 futures are pointing cautiously higher, so a bit of a corrective pullback may be in the cards if interest rates edge up a bit in risk-on trade.
Crude oil prices marked time, unmoved as EIA inventory data showed a larger-than-expected drawdown. The figures showed stockpiles shedding 7.21 million barrels last week whereas analysts expected a 3.13 million outflow. The tame response probably owed to API telegraphing a large drop yesterday.
Earnings reports form some of the energy sector’s leading firms now enter the spotlight. ConocoPhilips, Valero and Marathon are among the firms due to report in the coming hours. Traders will comb through the firms’ forward guidance statements to inform supply/demand trend expectations.
Need help with your commodities trading strategy? Join a webinar to ask questions live!
GOLD TECHNICAL ANALYSIS – Gold prices are testing above chart inflection point support at 1260.85, with a break higher opening the door for a test of the door for a test of the 38.2% Fibonacci expansion at 1271.20. Beyond that, the 1291.65-95.46 zone (50% level, double top) comes into focus. Alternatively, a turn below the 23.6% Fib at 1245.91 exposes the 14.6% expansion at 1230.31 anew.
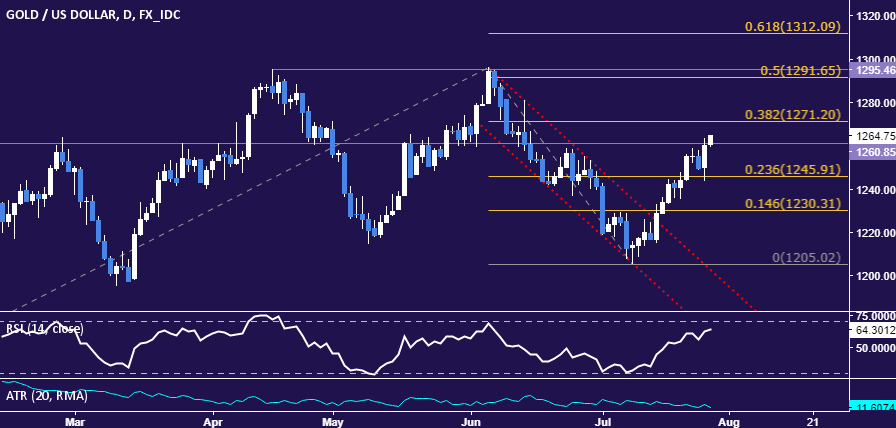
Chart created using TradingView
CRUDE OIL TECHNICAL ANALYSIS – Crude oil prices have stalled near resistance at 48.65, the 50% Fibonacci retracement. A sustained push above this barrier sees the next upside threshold at 50.19 (61.8% level, trend line). Alternatively, a reversal back below the 38.2% Fib at 47.10 exposes support at 45.32.
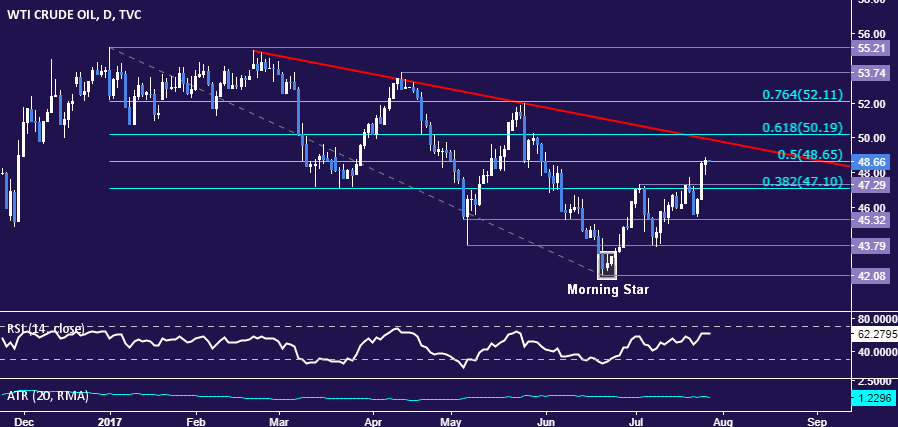
Chart created using TradingView
--- Written by Ilya Spivak, Currency Strategist for DailyFX.com
To receive Ilya's analysis directly via email, please SIGN UP HERE
Contact and follow Ilya on Twitter: @IlyaSpivak


