


Talking Points:
- Gold prices extend gains as Fed rate hike speculation continues to wilt
- Crude oil price rally fades as API reveals inventory build, EIA data next
- What will drive crude oil and gold prices through Q3? See our forecasts
Gold prices continued rise as Fed rate hike bets wilted, sending the US Dollar lower alongside front-end Treasury bond yields and boosting the relative appeal of non-interest-bearing and anti-fiat assets. Markets now price the probability of another hike before year-end at 42.3 percent, down from 49.1 percent a week ago. A further unwinding of the “Trump trade” seemed to be reasoning du jour.
From here, a lull in scheduled event risk shaping global yield trends may translate into consolidation for the yellow metal. Monetary policy announcements form the BOJ and the ECB are the next major inflection points, but those will have to wait until Thursday. News-flow from Washington DC remains an ever-present source of potential volatility however.
Crude oil prices managed an intraday bounce despite news that Ecuador withdrew from the OPEC-led production cut scheme amid reports that Saudi Arabia is mulling a further export reduction of 1 million b/d. The cartel also invited Libya – thus far exempt from coordinated output cuts – to a strategy meeting in St. Petersburg on July 22. That stoked speculation that it might be brought into the fold.
The rally fell apart however as API reported that US inventories added 1.63 million barrels last week. Official EIA data is expected to show a 3.5 million barrel drawdown over the same period. If that outcome registers closer in line with the API projection, the WTI benchmark may face further selling pressure as the prospects for global oversupply reduction darken.
Have a question about trading gold and crude oil? Join a trading Q&A webinar and ask it live!
GOLD TECHNICAL ANALYSIS – Gold prices rose for a third consecutive day, breaching resistance marked by the 38.2% Fibonacci retracementat 1239.60. The next upside barrier comes in at 1250.38, the 50% level, with a further push beyond that aiming for the 61.8% Fib at 1261.16. Alternatively, a move back below 1239.60 – now recast as support – exposes the 23.6% retracement at 1226.26 anew.

Chart created using TradingView
CRUDE OIL TECHNICAL ANALYSIS – Crude oil prices remain stuck below resistance at 47.10, the 38.2% Fibonacci retracement. A break above that confirmed on a daily closing basis targets the 50% level at 48.65 next. Alternatively, a reversal back below chart inflection point supportat 45.32 opens the door for a retest of the May 5 low at 43.79.
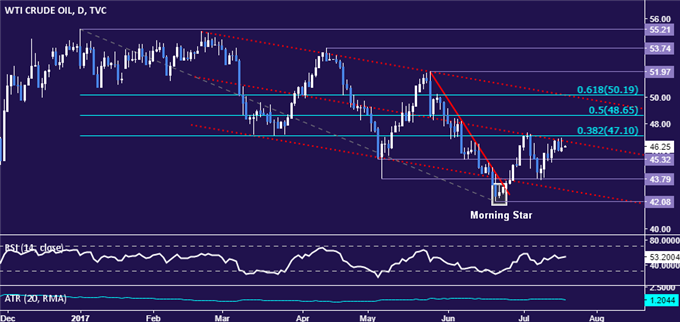
Chart created using TradingView
--- Written by Ilya Spivak, Currency Strategist for DailyFX.com
To receive Ilya's analysis directly via email, please SIGN UP HERE.
Contact and follow Ilya on Twitter: @IlyaSpivak


