


Talking Points:
- Crude oil prices decline as oversupply worries take center stage again
- Gold prices aim to extend gains as “Trump trade” unwinding heats up
- Where will gold and crude oil prices be in 3 months? See our forecasts
Crude oil prices fell amid reports that compliance with the OPEC-led production cut accord fell to 92 percent in June from 110 percent in the prior month. That was compounded by the EIA saying US shale output will hit 5.58 barrels per day in August, an all-time high, as well as news ofan increase in output from Libya.
The spotlight now turns to weekly API inventory flow statistics. Official EIA data are expected to show a 4.2 million barrel outflow on Wednesday. The API print will be judged against that forecast, with a larger drawdown likely to boost prices while a smaller one may hurt them.
Gold prices rose for a second day as cooling Fed rate hike bets bolstered the appeal of non-interest-bearing and anti-fiat assets. More of the same may be ahead as another US healthcare reform effort ends in failure, triggering broad-based unwinding of the so-called “Trump trade”.
Need help turning commodities news into an actionable strategy? Check out our trading guide !
GOLD TECHNICAL ANALYSIS – Gold prices have challenge resistance at 1239.60 (trend line support-turned-resistance, 38.2% Fibonacci retracement), with a break above that confirmed on a daily closing basis exposing the 50% level at 1250.38. Alternatively, a move back below the 23.6% Fib at 1226.26 eyes a minor chart pivot level at 1219.35, followed by the July 10 low at 1204.70.

Chart created using TradingView
CRUDE OIL TECHNICAL ANALYSIS – Crude oil prices continue to bump against resistance at 47.10, the 38.2% Fibonacci retracement. A daily close above that targets the 50% level at 48.65. Alternatively, a turn below chart inflection point supportat 45.32 exposes the May 5 lowat 43.79 anew.
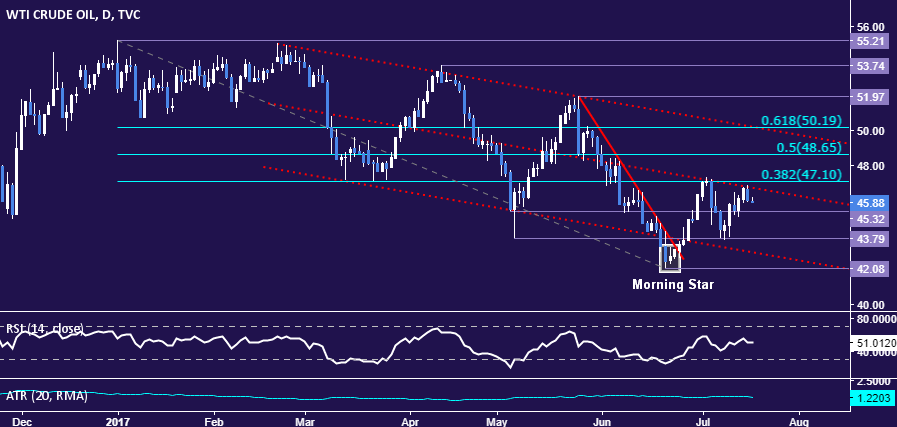
Chart created using TradingView
--- Written by Ilya Spivak, Currency Strategist for DailyFX.com
To receive Ilya's analysis directly via email, please SIGN UP HERE
Contact and follow Ilya on Twitter: @IlyaSpivak


