


Talking Points:
- Gold prices gain after downbeat US data weighs on Fed rate hike outlook
- Crude oil prices rise on Nigeria disruption, EIA drilling report now on tap
- See our forecasts to learn what will drive crude oil and gold trends in Q3
Gold prices soared after a disappointing round of US economic data cooled Fed rate hike speculation, pushing the US Dollar lower alongside front-end Treasury yields (as expected). Not surprisingly, that increased the appeal of anti-fiat and non-interest-bearing assets including the yellow metal.
From here, a lull in top-tier scheduled event risk may put risk appetite trends in control of price action. A risk-on mood may see yields rising, hurting gold. Souring market sentiment may deliver the opposite results. A clear directional lead from US and European index futures is absent for now however.
Crude oil prices rose after Shell declared force majeure on Nigerian Bonny Light grade exports. The supply disruption may play into OPEC’s hands: the cartel’s production-cut efforts have been bedeviled by rising production from Nigeria and Libya, member states that are nonetheless exempt from output quotas.
The spotlight now turns to the monthly EIA Drilling Productivity report. Markets will look to the data to see the extent to which swing US supply growth can keep prices capped, undermining OPEC-led efforts to drive them upward.
Need help turning commodities news into an actionable strategy? Check out our trading guide !
GOLD TECHNICAL ANALYSIS – Gold prices broke above channel resistance defining the down trend since early June. From here, the next layer of resistance comes in at 1239.60 (trend line support-turned-resistance, 38.2% Fibonacci retracement). A daily close above that opens the door for a test of the 50% level at 1250.38. Alternatively, a reversal back below the 23.6% Fib at 1226.26 targets a minor chart pivot at 1219.35, followed by the July 10 low at 1204.70.

Chart created using TradingView
CRUDE OIL TECHNICAL ANALYSIS – Crude oil prices are back to test resistance at 47.10, the 38.2% Fibonacci retracement, with a break above that confirmed on a daily closing basis exposing the 50% level at 48.65. Alternatively, a reversal below chart inflection point supportat 45.32 paves the way for another test of the May 5 lowat 43.79.
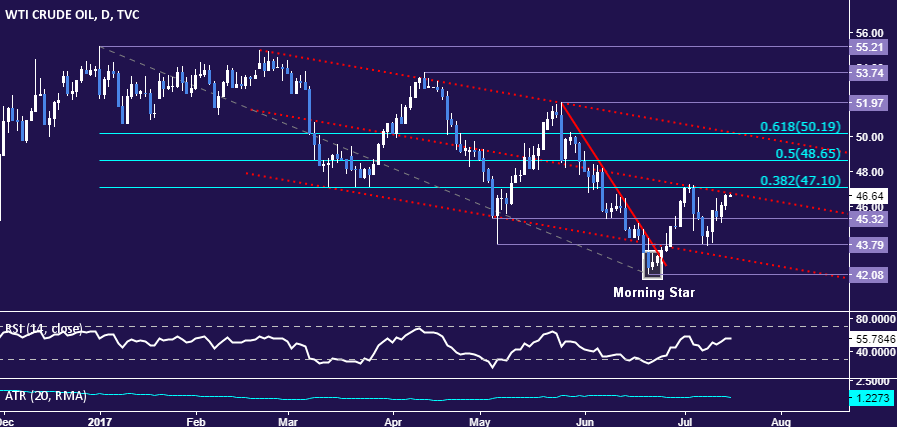
Chart created using TradingView
--- Written by Ilya Spivak, Currency Strategist for DailyFX.com
To receive Ilya's analysis directly via email, please SIGN UP HERE
Contact and follow Ilya on Twitter: @IlyaSpivak


