


Talking Points:
- Crude oil prices looking to World Petroleum Congress for a lifeline
- Gold prices may fall further Treasury bond yields rise in risk-on trade
- What will drive Q3 crude oil and gold trends? See our forecasts here
Crude oil continued to sink despite a larger-than-expected weekly US inventory drawdown as output continued to surpass outflows. The EIA reported that US production rose to 9.34 million barrels per day last week, marking the biggest increase since January.
From here, the spotlight turns to the World Petroleum Congress getting underway in Istanbul, Turkey. Sideline comments from a formidable roundup of industry bigwigs may prove market-moving if OPEC officials and their allies sound off on deeper output cut possibilities.
Gold prices plunged as the US Dollar rose following the release of better-than-expected US labor-market data. The figures lent credence to the Fed’s hawkish posture, undermining support for anti-fiat and non-interest-bearing assets including the yellow metal.
Looking ahead, a lull in top-tier event risk may put sentiment trends at the forefront. S&P 500 futures are pointing higher, hinting that the upbeat mood on Asian bourses is aiming to carry onward. That may nudge bond yields higher, pushing gold lower still.
Have a question about crude oil and gold prices? Join a trading Q&A webinar and ask it live!
GOLD TECHNICAL ANALYSIS – Gold prices broke below the May 9 lowat 1214.40, paving the way for a challenge of the 1195.13-99.67 area (March 10 low, 38.2% Fibonacci expansion). A break of this barrier confirmed on a daily closing basis exposes the 50% level at 1169.89. Alternatively, a move back above 1214.14 – now recast as resistance – targets the 23.6% level at 1236.51.

Chart created using TradingView
CRUDE OIL TECHNICAL ANALYSIS – Crude oil prices fell for a third consecutive day, with sellers now testing support in the 43.51-79 area (38.2% Fibonacciexpansion, May 5 low). A daily close below that opens the door for a retest of the 42.08-35 region (June 21 low, 50% Fib). Alternatively, a move above the 44.96-45.32 zone (former support, 23.6% expansion) targets resistance in the 47.03-12 range.
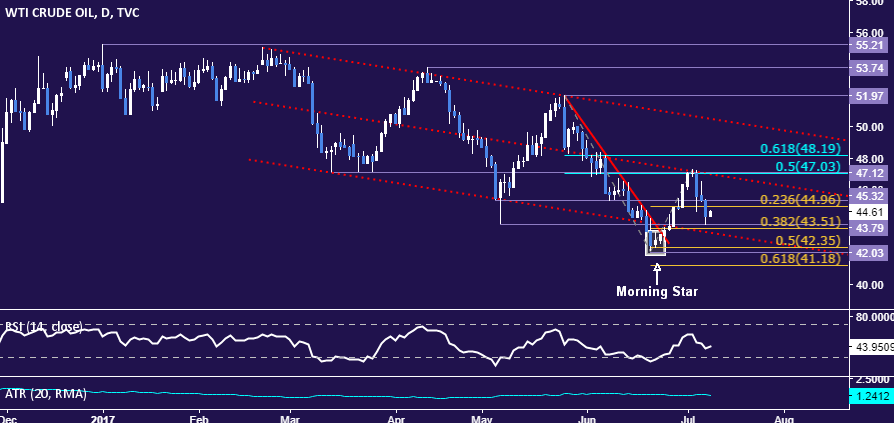
Chart created using TradingView
--- Written by Ilya Spivak, Currency Strategist for DailyFX.com
To receive Ilya's analysis directly via email, please SIGN UP HERE
Contact and follow Ilya on Twitter: @IlyaSpivak


