


Talking Points:
- Crude oil prices may bounce if EIA inventory data echoes API view
- Gold prices look to ADP, ISM figures to shape Fed rate hike outlook
- Where will gold and crude oil prices go next? See our Q3 forecasts
Crude oil prices plunged, posting the largest one-day loss in a month, as investors digested a toxic batch of headlines. Perhaps most critically, Russia was said to oppose a deeper cutback in production beyond thresholds established in the existing OPEC-led output cut scheme.
From here, EIA inventory flow figures are in focus. Forecasts suggest a drawdown of nearly 1.8 million barrels last week but data from API published yesterday projected a far larger 5.8 million barrel outflow over the same period. Results closer in line with that estimate may offer prices a lifeline.
Gold prices dipped to a two-month low but failed to gain serious traction, ultimately ending the day in familiar territory. Minutes from June’s FOMC meeting offered mixed cues. Policymakers remained hawkish on the subject of rate hikes but sounded unsure on balance sheet reduction.
The spotlight now turns to ADP data on US employmentand the ISM non-manufacturing survey are. Both are expected to have weakened in June. If the outcomes echo a recent positive turn in US economic news-flow however, firming Fed rate hike bets may weigh heavily on the yellow metal.
Have a question about trading commodities? Join a Q&A webinar and ask it live!
GOLD TECHNICAL ANALYSIS – Gold prices are digesting losses after sinking to the lowest level in two months. Near-term support is at 1214.40, the May 9 low, followed by the 1195.13-99.67 area (March 10 low, 38.2% Fibonacci expansion). On the upside, a reversal back above the 23.6% level at 1236.51 clears the way for a retest of the 14.6% Fib at 1259.22.
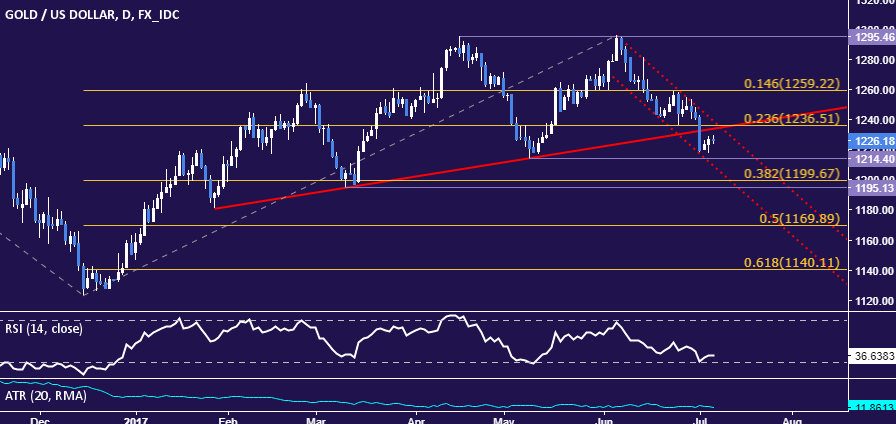
Chart created using TradingView
CRUDE OIL TECHNICAL ANALYSIS – Crude oil prices recoiled from resistance in the 47.03-12 area (March 14 low, channel mid-line, 50% Fibonacci retracement). From here, a daily close below the 23.6% Fib expansion at 44.96 opens the door for a test of the 43.51-79 zone (38.2% level, May 5 low). Alternatively, a push above 47.12 exposes the 61.8% retracement at 48.19.
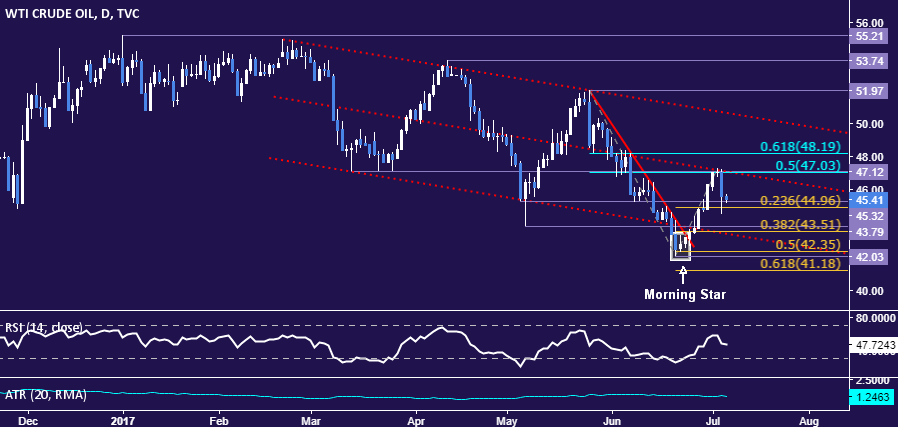
Chart created using TradingView
--- Written by Ilya Spivak, Currency Strategist for DailyFX.com
To receive Ilya's analysis directly via email, please SIGN UP HERE
Contact and follow Ilya on Twitter: @IlyaSpivak


