


Talking Points:
- Gold prices drop as ISM data helps reboot Fed rate hike speculation
- Crude oil prices continue to correct higher as US production slows
- Where will gold and crude oil prices go next? See our Q3 forecasts
Gold prices suffered the largest decline in over seven months as US Treasury bond yields rose alongside the US Dollar, sapping the appeal of anti-fiat and non-interest-bearing assets. A hawkish shift in Fed policy expectations probably accounted for the move.
The priced-in probability of a hike at the September and December meetings of the rate-setting FOMC committee ticked up by 6.1 and 5.7 percentage points from the prior day, respectively. June’s surprisingly strong manufacturing ISM print may have driven the adjustment.
Crude oil prices continued to recover in a move that seemed to echo Friday’s news-flow. Baker Hughes reported that the number of active US extraction rigs fell for the first in 24 weeks. Meanwhile, the EIA said US output in April was 190k barrels lower than it previously reported.
A quiet day seems likely ahead as US markets remain offline for the Independence Day holiday. Trade in on-exchange products including oil futures will close early but thin liquidity might amplify kneejerk volatility in OTC spot gold if unexpectedly potent headline risk catches investors off-guard.
What do retail traders’ gold buy/sell decisions hint about the price trend? Find out here !
GOLD TECHNICAL ANALYSIS – Gold prices crashed through rising trend support guiding the move higher since late January. Sellers now aim to challenge the May 9 low at 1214.13, followed by the 1194.86-99.25 area (March 10 low, 38.2% Fibonacci expansion). Alternatively, a reversal back above the 23.6% level at 1236.39 targets the 14.6% Fib at 1259.11.
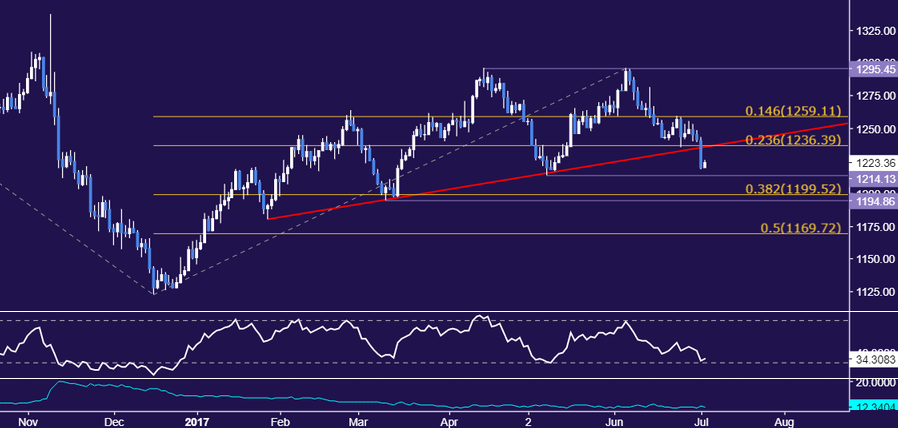
Chart created using TradingView
CRUDE OIL TECHNICAL ANALYSIS – Crude oil prices continue to push higher after putting in a bullish Morning Star candlestick pattern. From here, a daily close above the 47.00-12 area (March 14 low, channel mid-line, 50% Fibonacci retracement) exposes the 61.8% level at 48.17. Alternatively, a turn back below 45.32 (May 4 bottom) opens the door for a retest of 43.79 (May 5 low).
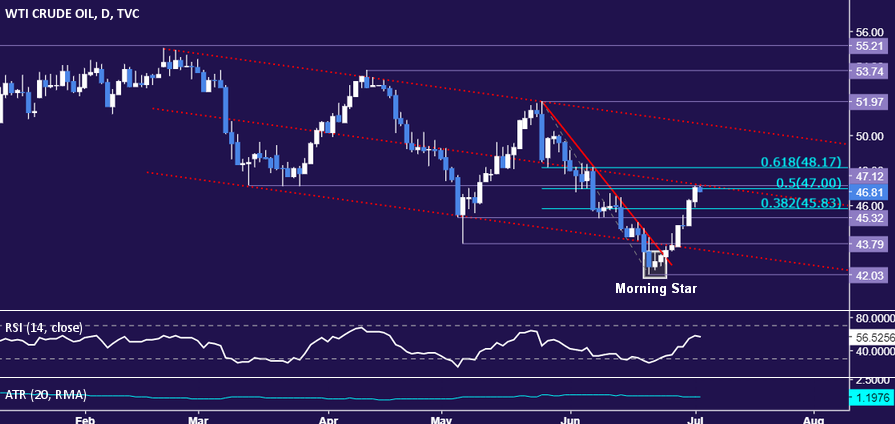
Chart created using TradingView
--- Written by Ilya Spivak, Currency Strategist for DailyFX.com
To receive Ilya's analysis directly via email, please SIGN UP HERE
Contact and follow Ilya on Twitter: @IlyaSpivak


