


Talking Points:
- Crude oil prices snap 5-day win streak before key OPEC meeting
- Gold prices edge up on FOMC minutes but familiar range holds
- Oil output cut extension may underwhelm as gold awaits US GDP
Crude oil prices paused to digest gains having hit a one-month high, snapping a five-day winning streak, as all eyes turn to a much-anticipated OPEC meeting in Vienna. The cartel and like-minded external producers are widely expected to extend an output cut scheme introduced in late 2016 and expiring mid-year for another nine months.
The move is unlikely to offer prices much support having been unambiguously signaled by key officials in recent weeks, meaning traders are unlikely to hear much that is not already in the market. Indeed, a period of profit-taking may ensue as speculation becomes reality, sending crude lower. An unexpectedly shorter extension – for six months versus nine, for example – is likely to amplify selling pressure.
Gold prices rose following the release of minutes from May’s FOMC policy meeting. Traders made much of voting members saying it is “prudent to await evidence [that the first-quarter] slowdown is transitory,” brushing off an otherwise familiar cautiously hawkish tone. The US Dollar dropped alongside front-end Treasury bond yields, boosting the appeal of anti-fiat and non-interest-bearing assets.
Critically, investors’ priced-in outlook implied in Fed Funds futures still has a June rate hike as a near-certainty. This hints that gold may find it difficult to extend gains unless the tidbit of reluctance that emerged in the Minutes document is supported by hard economic data. That will have to wait for Friday’s revised first-quarter US GDP figures. In the meantime, consolidation seems likely.
Retail traders expect gold prices to rise. Find out here what this hints about the coming trend!
GOLD TECHNICAL ANALYSIS – Gold prices are still treading water below resistance in the 1256.74-63.87 area, an area of both up- and downside significance in the past three months. A daily close above that opens the door for a test of falling trend resistance at 1278.76. Alternatively, a move back below the 23.6% Fibonacci expansion at 1235.91 exposes rising trend support at 1219.83.

Chart created using TradingView
CRUDE OIL TECHNICAL ANALYSIS – Crude oil prices continue edge toward resistance at 52.51, the 76.4%Fibonacci retracement. Breaking that boundary on a daily closing basis exposes falling trend line resistance at 53.09. Alternatively, a turn back below the 61.8%level at 50.85 sees the next downside barrier at 49.50, the 50% Fib.
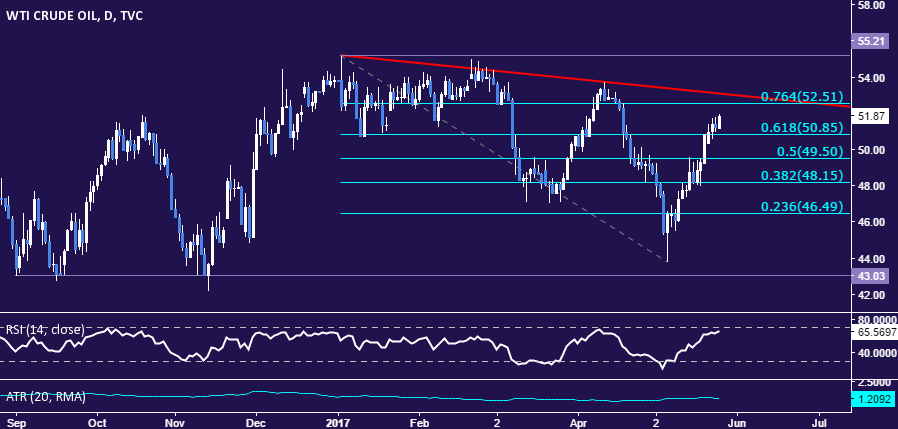
Chart created using TradingView
--- Written by Ilya Spivak, Currency Strategist for DailyFX.com
To receive Ilya's analysis directly via email, please SIGN UP HERE
Contact and follow Ilya on Twitter: @IlyaSpivak


