


Talking Points:
- Crude oil prices digesting after last week’s blistering decline
- OPEC monthly report, API inventory data may rekindle selloff
- Gold prices unlikely to extend losses as FOMC looms ahead
Crude oil prices are taking a respite from last week’s blistering selloff. The lull may be short-lived however as a fresh batch of supply indicators cross the wires. The OPEC monthly report will show production estimates for February and help gauge if its coordinated supply cuts still some bite. API weekly inventory flow figures will help show if swing supply continues to swell, undermining OPEC’s efforts.
Gold prices are digesting losses after falling to the lowest level in six weeks against the backdrop of firming Fed interest rate hike speculation. A recovering US Dollar is making for a degree of selling pressure but progress may be limited in the near term, with traders reluctant to show directional commitment until after the passing of the FOMC policy announcement on Wednesday.
Are crude oil and gold prices matching DailyFX forecasts so far in 2017? Find out here !
GOLD TECHNICAL ANALYSIS – Gold prices fell as expected after producing a bearish Dark Cloud Cover candlestick pattern. From here, a move below the 38.2% Fibonacci expansion at 1181.92 exposes the 50% level at 1156.61. Alternatively, a turn above support-turned-resistance at 1218.90 opens the door for a retest of the 14.6% Fib at 1232.55.
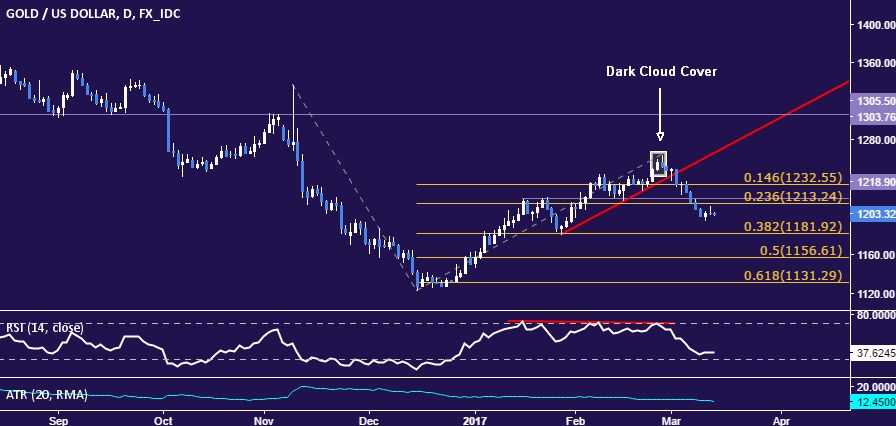
Chart created using TradingView
CRUDE OIL TECHNICAL ANALYSIS – Crude oil prices are digesting losses after dropping to the lowest level in nearly four months. From here, a daily close below the 50% Fibonacci retracement at 47.22 exposes the 61.8% level at 45.33. Alternatively, a reversal above the 38.2% Fib at 49.11 targets the 23.6% retracement at 51.44.
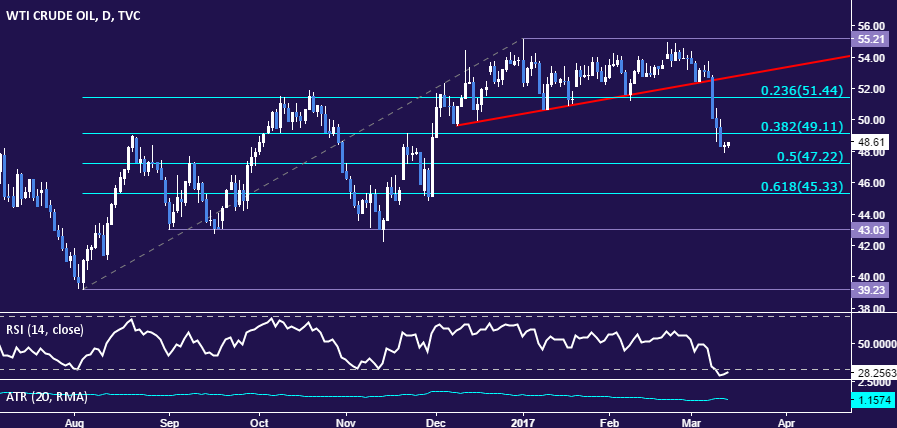
Chart created using TradingView
--- Written by Ilya Spivak, Currency Strategist for DailyFX.com
To receive Ilya's analysis directly via email, please SIGN UP HERE
Contact and follow Ilya on Twitter: @IlyaSpivak


