


Talking Points:
- Gold prices may fall on hawkish FOMC minutes, validating chart setup
- Crude oil prices hit 2-month high as OPEC talks tough on output cuts
- API inventory data, IP Week comments round out scheduled event risk
Gold prices bounced sharply higher form intraday lows, finishing yesterday’s session little-changed having fallen nearly 1 percent. The metal recovered as the US Dollar retreated alongside Treasury bond yields, boosting the appeal of non-interest-bearing and anti-fiat assets. The move followed a disappointing round of PMI surveys. The numbers showed that the pace of manufacturing- and service-sector growth slowed by the most in nine months in February.
Crude oil prices broke upward out of a two-month range to take aim at the year-to-date high for the WTI benchmark. Gains appeared to followed supportive comments from OPEC Secretary General Mohammad Barkindo, who said the cartel will aim for a much higher degree of compliance with last year’s output cut accord than the 90 percent achieved in January. He added that the group will achieve 100 percent compliance “in due course”.
Barkindo spoke in an interview with Bloomberg news from the sidelines of the IP Week conference in London. The summit heads into its second day today, with another round of comments from industry bigwigs on tap. OPEC’s committee monitoring production cut compliance is also due to convene in Vienna to review supply levels, which may produce market-moving headlines. Finally, the weekly crude oil inventory flow estimate from the American Petroleum Institute (API) is set to cross the wires.
As for gold, the spotlight is on minutes from February’s FOMC meeting. A hawkish tone echoing remarks from a broad range of central bank officials including Chair Yellen that bolsters the probability of a March rate hike is likely boost the greenback and baseline yields alike. Needless to say, that is likely to bode ill for alternative store-of-value assets including the yellow metal. A similar message on display in comments from Governor Jerome Powell could amplify the move.
What do traders’ buy and sell decisions say about the gold price trend? Find out here !
GOLD TECHNICAL ANALYSIS – A double top may be forming February’s swing top, marked by Dark Cloud Cover and Bearish Engulfing candlestick patterns. A daily close below the 23.6% Fibonacci retracement at 1215.75 targets the 38.2% levelat 1197.99. Alternatively, a breach above the 23.6% Fib expansion at 1245.29 opens the door for a test of the 38.2% level at 1263.05.
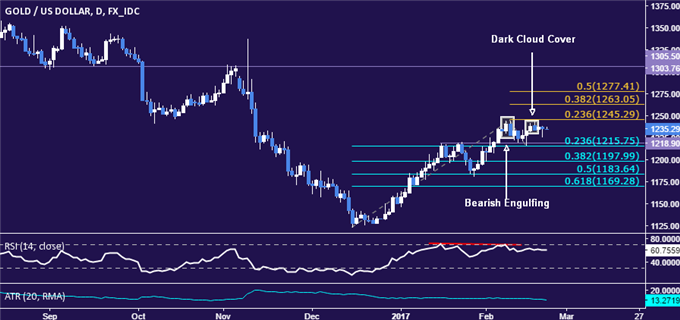
Chart created using TradingView
CRUDE OIL TECHNICAL ANALYSIS – Crude oil prices finally overcome range top resistance at 53.86, a barrier that had capped the upside since late December. From here, buyers aim to challenge the 55.21-65 area (January 3 high, 38.2% Fibonacci expansion), with a further push above that targeting the 50% level at 57.18. Alternatively, a move back below 53.86 aims for rising trend line support at 52.07.
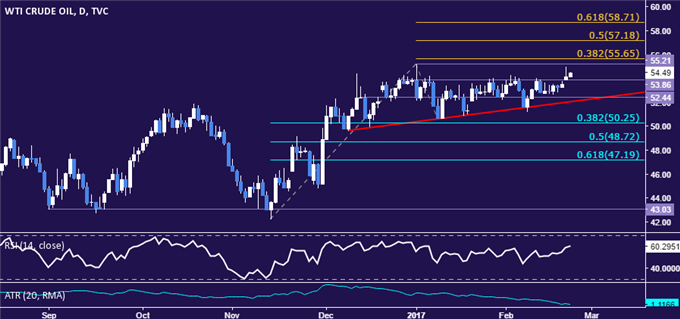
Chart created using TradingView
--- Written by Ilya Spivak, Currency Strategist for DailyFX.com
To receive Ilya's analysis directly via email, please SIGN UP HERE
Contact and follow Ilya on Twitter: @IlyaSpivak


