


Talking Points:
- Crude oil prices muted as US Dollar, OPEC compete for influence
- API inventories data may show swing producers to undo supply cut
- Gold prices continue to find support in “Trump trade” unwinding
Crude oil are marking time in familiar territory, with traders seemingly uninspired to take firm directional bets amid a tug of war between supportive US Dollar weakness and skepticism about the lasting influence of OPEC’s supply cut deal. Weekly inventory flow data from API may get help break the deadlock in the coming hours.
Baker Hughes reported that the number of operating US oil rigs rose to the highest in 14 months last week. If this is followed by a pickup in stockpiles, that may bolster the recently emerging sense that OPEC’s price-boosting efforts might be self-defeating as swing producers ramp up production. Needless to say, the crude oil may come under pressure in this scenario.
Gold prices continue to find support in the unwinding of the so-called “Trump trade”. Lingering fiscal policy uncertainty is casting doubt on prior bets that the new US administration will stoke inflation and beckon a steeper Fed rate hike cycle. A relatively quiet economic data docket in the hours ahead doesn’t seem to offer meaningful roadblocks to this dynamic, hinting the yellow metal may remain supported.
Will gold and crude oil prices continue higher in the first quarter? See our forecasts to find out!
GOLD TECHNICAL ANALYSIS – Gold prices seem to have overturned a bearish Dark Cloud Cover candlestick pattern put in last week. Still, negative RSI divergence warns of ebbing upside momentum and may be hinting at an on-coming downturn. A daily close below 1199.80 exposes the 23.6% Fibonacci retracement at 1182.36. Alternatively, a breach above the 38.2% level at 1219.20 sees the next upside barrier in the 1248.98-50.65 area (50% level, June 24 low).

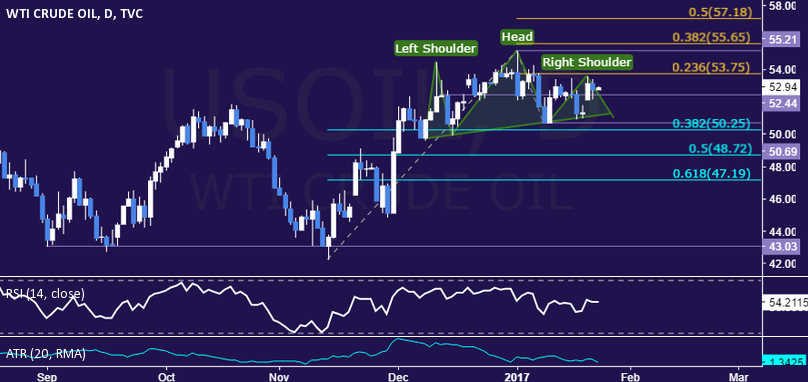
CRUDE OIL TECHNICAL ANALYSIS – Crude oil price positioning has been little-changed in recent days, with a would-be Head and Shoulders top still in the works. Breaking back below 52.44 exposes the 50.25-69 area (38.2% Fibonacci retracement, January 10 low), with a subsequent daily close under that confirming the bearish chart pattern. Alternatively, a push above the 23.6% Fib expansion at 53.75 opens the door for a test of the 55.21-65 zone (January 3 high, 38.2% expansion).
--- Written by Ilya Spivak, Currency Strategist for DailyFX.com
To receive Ilya's analysis directly via email, please SIGN UP HERE
Contact and follow Ilya on Twitter: @IlyaSpivak


