


Talking Points:
- Gold prices continue to tread water near ten-month lows
- Crude oil prices drop as EIA reports inventories increase
- Revised 3Q US GDP figures may pass with little fanfare
Gold prices continue to mark time near a ten-month low put in last week as a lull in trend-defining news-flow leaves markets rudderless and the pre-holiday liquidity drain saps conviction. Crude oil retreated after the weekly EIA inventories report unexpectedly showed stockpiles grew last week, adding 2.26 million barrels. This result clashed with economists’ bets and a private-sector estimate from API.
The final revision of third-quarter US GDP is on tap ahead, with a modest upgrade from 3.2 to 3.3 percent for the annualized rate expected. The outcome may not inspire much of a response however considering its limited implications for the Fed rate-hike trajectory as the 2017 fiscal policy outlook remains the central object of speculation.
See the schedule of upcoming webinars and join us LIVE to follow the financial markets!
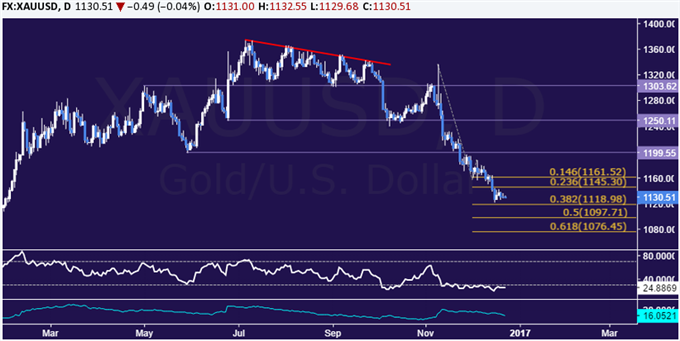
GOLD TECHNICAL ANALYSIS – Gold prices remain locked in a narrow range above the $1100/oz figure. Near-term support is at 1118.98, the 38.2% Fibonacci expansion, with a break below that on a daily closing basis exposing the 50% level at 1097.71. Alternatively, a reversal above the 23.6% Fib at 1145.30 targets the 14.6% expansion at 1161.52.
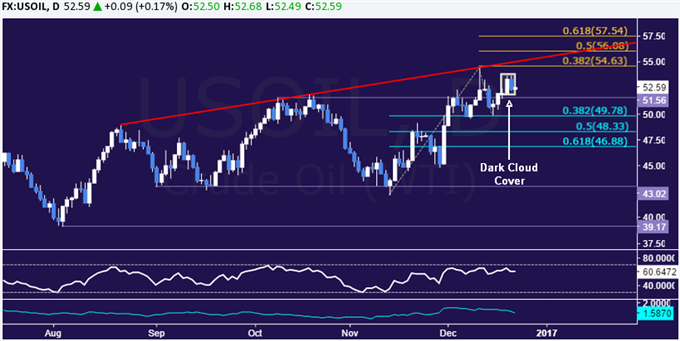
CRUDE OIL TECHNICAL ANALYSIS – Crude oil prices put in a bearish Dark Cloud Cover candlestick pattern, hinting a move lower may be ahead. A daily close below the 38.2% Fibonacci retracement at 49.78 exposes the 50% level at 48.33. Alternatively, a push above the 54.63-55.07 area (38.2% Fib expansion, trend line) targets the 50% threshold at 56.08.
--- Written by Ilya Spivak, Currency Strategist for DailyFX.com
To receive Ilya's analysis directly via email, please SIGN UP HERE
Contact and follow Ilya on Twitter: @IlyaSpivak


