


Talking Points:
- Crude oil prices struggling at chart barrier after OPEC rally
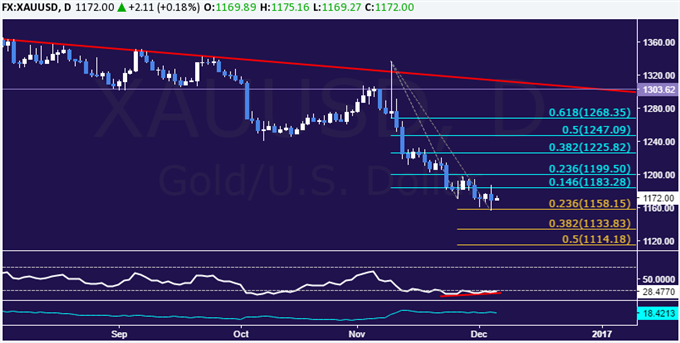
- Gold prices may recover amid lull in Fed-linked news flow
- API inventory data, UK Brexit appeal headline key event risk
Crude oil prices corrected lower as markets digested last week’s gains in the wake of a last-minute OPEC output cut accord. Non-OPEC producers with meet with members of the cartel in Vienna on December 10 to discuss cooperation with the scheme. In the meantime, traders may turn to more mundane matters, with the API estimate of weekly inventory flows on tap today.
Gold prices are consolidating below the $1200 figure amid a lull in fresh news-flow informing the Fed policy outlook. A quiet US docket through much of the week may open the door for a corrective rebound amid profit-taking on short positions after recent weakness. A pending Brexit implementation ruling from the UK Supreme Court may also a bit of direction to the extent that it influences broader sentiment trends.
See the schedule of upcoming webinars and join us LIVE to follow the financial markets!
GOLD TECHNICAL ANALYSIS – Gold prices continue to tread water in familiar territory but the emergence of positive RSI divergence hints a bounce may be brewing ahead. A daily close above the 14.6% Fibonacci retracement at 1183.28 opens the door for a test of the 23.6% level at 1199.50. Alternatively, a push below the 23.6% Fib expansion at 1158.15 exposes the 38.2% threshold at 1133.83.
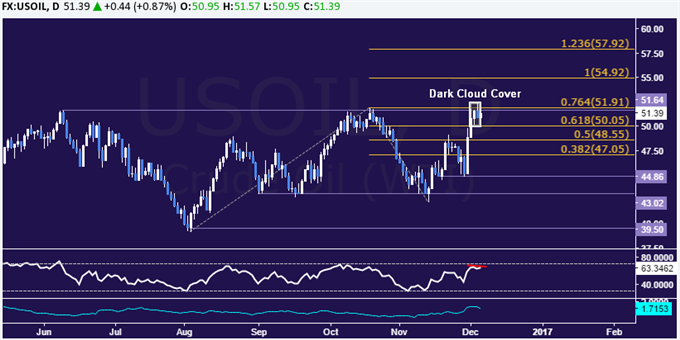
CRUDE OIL TECHNICAL ANALYSIS – Crude oil have stalled at familiar resistance in the 51.64-91 area (double top, 76.4% Fibonacci expansion). The appearance of a bearish Dark Cloud Cover candlestick pattern and early signs of negative RSI divergence hint a turn lower may be ahead. A break below the 61.8% levelat 50.05 targets the 50% Fib at 48.55.Alternatively, a push above resistance exposes the 100% expansion at 54.92.
--- Written by Ilya Spivak, Currency Strategist for DailyFX.com
To receive Ilya's analysis directly via email, please SIGN UP HERE
Contact and follow Ilya on Twitter: @IlyaSpivak


