


Japanese Yen, USD/JPY, Economic Calendar, Bank of Japan - Talking Points
- Traders set to trade with fresh eyes after digesting Fed, Bank of Japan policy decisions
- Light economic calendar leaves Asia-Pacific region subject to broader market risk trends
- USD/JPY may move lower despite the appearance of a bullish Golden Cross chart signal

US stock markets pulled back last week after the Federal Reserve’s March interest rate decision injected a fresh round of selling across US government bonds, pushing the Treasury curve higher along short- and long-dated issuances. The 10-year Treasury yield – a closely watched benchmark tenor watched by traders – moved higher by nearly 6%.
The S&P 500 and Dow Jones Industrial Average (DJIA) fell 0.77% and 0.46% last week, respectively. Technology stocks pulled back, with the Nasdaq 100 Index (NDX) giving up 0.54% while the small-cap Russell 2000 index shed 2.77%. Despite the weekly decline, US equity indexes remain within striking distance of all-time highs. Will investors may go into the week with their eyes set on the buy button?
S&P 500, Russell 2000, 10-Year Treasury Yield – 30 Minute Chart
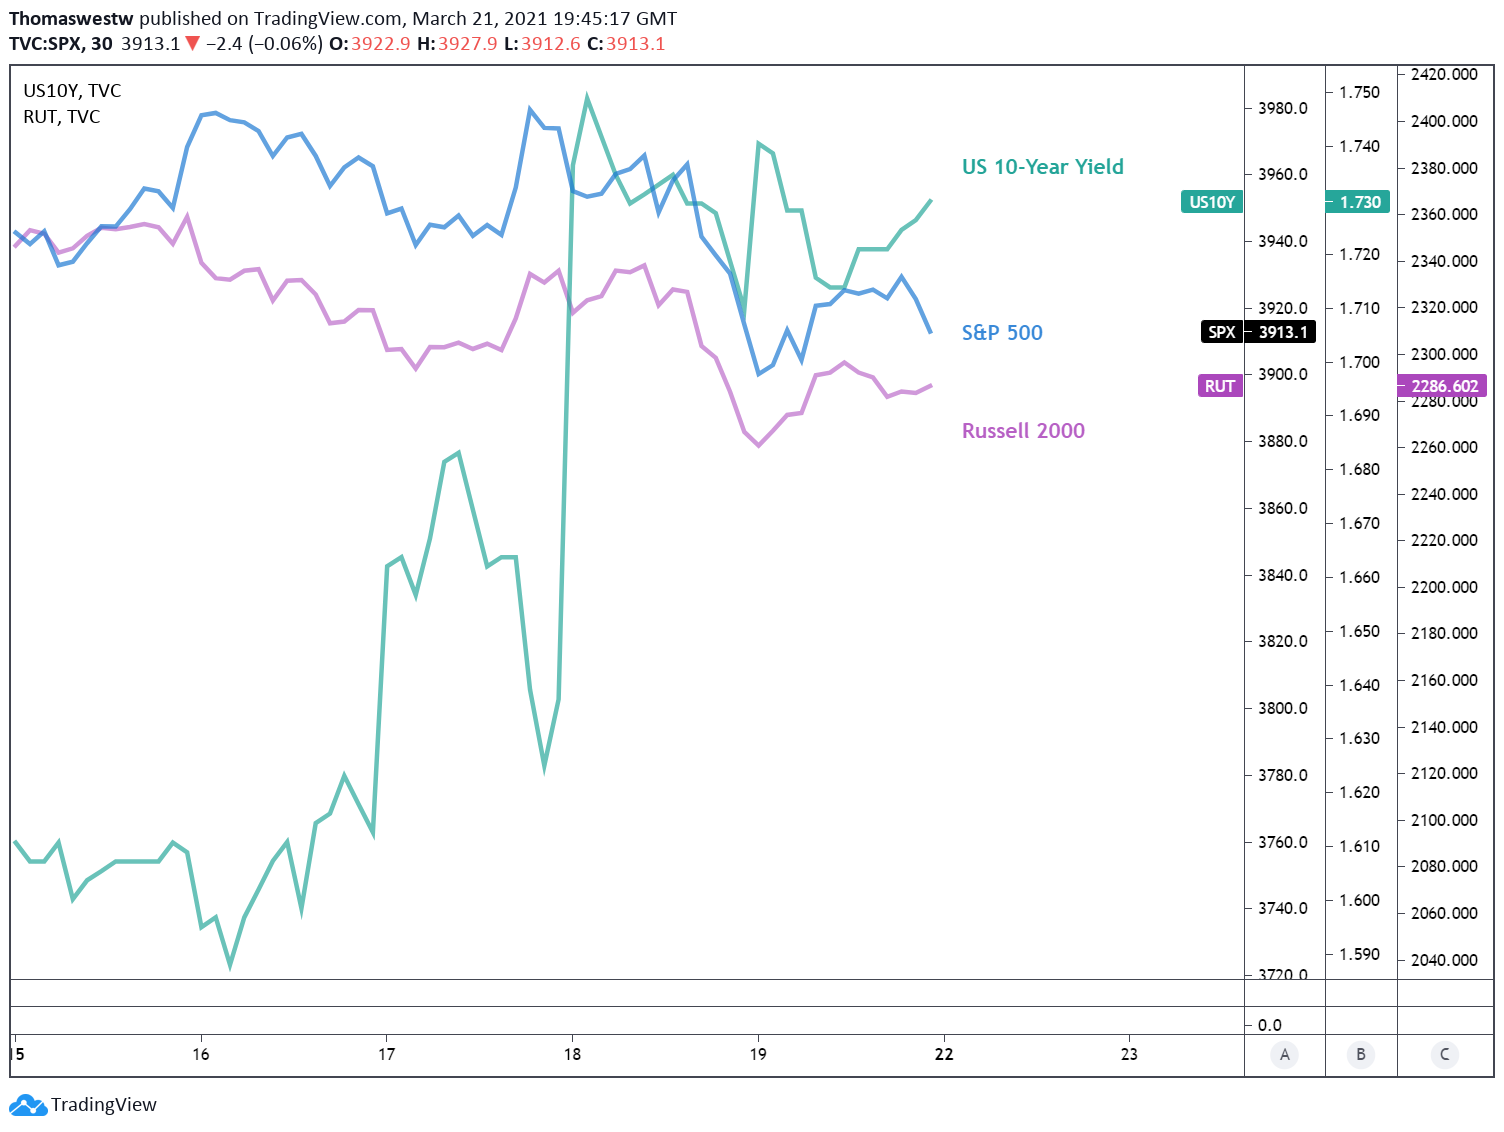
Chart created with TradingView

Monday’s Asia-Pacific Outlook
The DailyFX Economic Calendar is devoid of high-impact events for the week ahead across the Asia-Pacific region, which will likely leave APAC equity markets and currencies subject to broader risk trends. Still, Monday will see Japan release final readings on its coincident and leading economic indexes, with analysts expecting the figures to cross the wires at 91.7 and 99.1, respectively.
The Japanese Yen will likely be unaffected by today’s economic data considering the outcomes almost certainly mean little for the direction of monetary policy. Instead, traders likely spent the weekend digesting last week’s Bank of Japan policy tune-up. The Nikkei 225 fell after the central bank announced that it will only purchase Exchange-Traded Funds (ETFs) that track the Topix equity index.
Moreover, the BOJ increased the range by which it authorizes long-term rates to gyrate, increasing it from 0.20% to 0.25%. Policymakers will still allow temporary fluctuations outside of that range. While these changes appear minor, the Bank may be laying the groundwork for what it likely sees as a prolonged fight to achieve its goals. Nevertheless, these adjustments don’t indicate a shift away from its broadly dovish policy stance. This likely leaves the Yen looking elsewhere for direction, at least in the short-term.

USD/JPY Technical Outlook
The Yen gained against the Greenback last week, marking its second consecutive weekly advance. Still, USD/JPY could perhaps shift higher in the near-term following the formation of a bullish Golden Cross signal. The 78.6% Fibonacci retracement level may offer immediate support if prices continue lower. That area coincides with a zone of consolidation following the sharp move higher seen in early March.
However, if the 78.6% Fib level and 108 handle give way on a downside move, losses may accelerate and start to eat the currency pair’s monthly gains. While the moving average crossover is a bullish signal, the MACD line made a cross below its signal line, and the Relative Strength Index (RSI) is oriented downward after falling from overbought territory.
USD/JPY Daily Chart
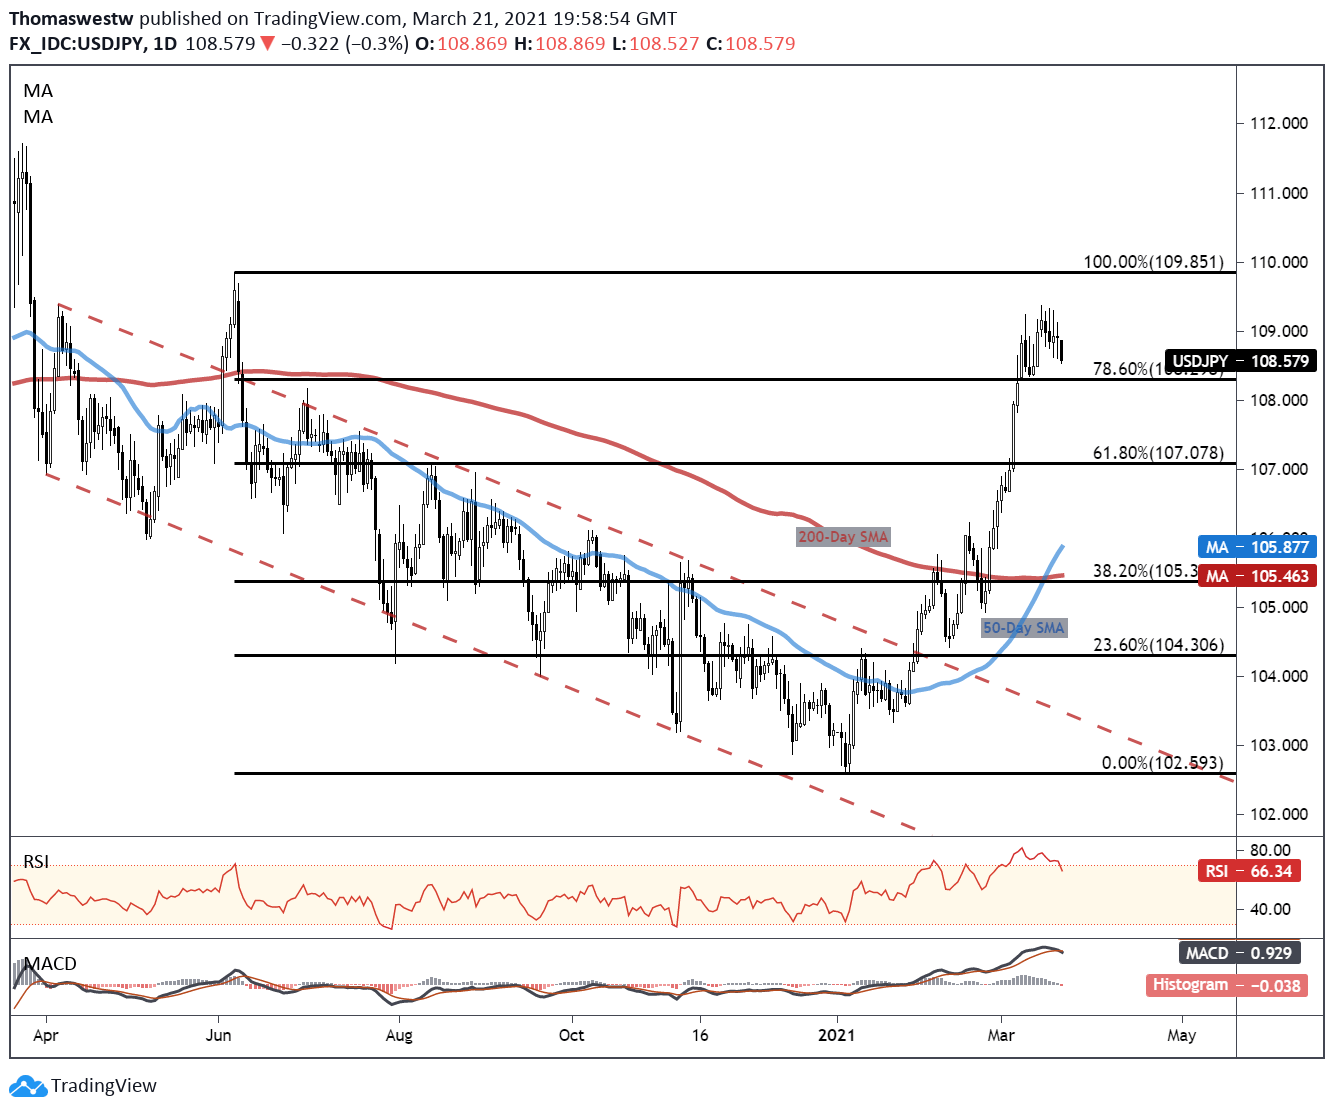
Chart created with TradingView
Japanese Yen TRADING RESOURCES
- Just getting started? See our beginners’ guide for FX traders
- What is your trading personality? Take our quiz to find out
- Join a free webinar and have your trading questions answered
--- Written by Thomas Westwater, Analyst for DailyFX.com
To contact Thomas, use the comments section below or @FxWestwater on Twitter


