


Japanese Yen, USD/JPY, CSI 300, BoJ Governor Kuroda - Talking Points
- Wall Street sees optimistic trading session as Dow and S&P 500 hit fresh record highs
- Chinese stock markets under pressure as traders weigh tightening liquidity conditions
- USD/JPY in focus after forming Golden Cross setup, BoJ Governor speech on tap today

US equity markets saw an influx of strength today as investors continue to grow more optimistic about the global economic recovery. The Dow Jones Industrial Average (DJIA), S&P 500, and small-cap Russell 2000 index all closed at record highs. Technology stocks also gained, pushing the Nasdaq 100 index 1.12% higher. The 10-year Treasury yield pulled back slightly, along with other longer-dated government bond rates.
Wall Street will now turn an eye to US retail sales for February, slated to cross the wires Wednesday. Analysts expect a 0.5% from the prior month, according to the DailyFX Economic Calendar. A better-than-expected figure may add to the economic rebound story as the vaccine rollout in the United States continues to progress.
The vaccine rollout in the United States has moved along better than initially expected. More than 109 million doses have been administered so far, according to Bloomberg. Markets will also be watching the Federal Reserve as the central bank begins a two-day meeting, after which it will announce how monetary policy is expected to evolve in the coming weeks and months.
Dow Jones vs US 10-Year Treasury Yield - 30-Minute Chart
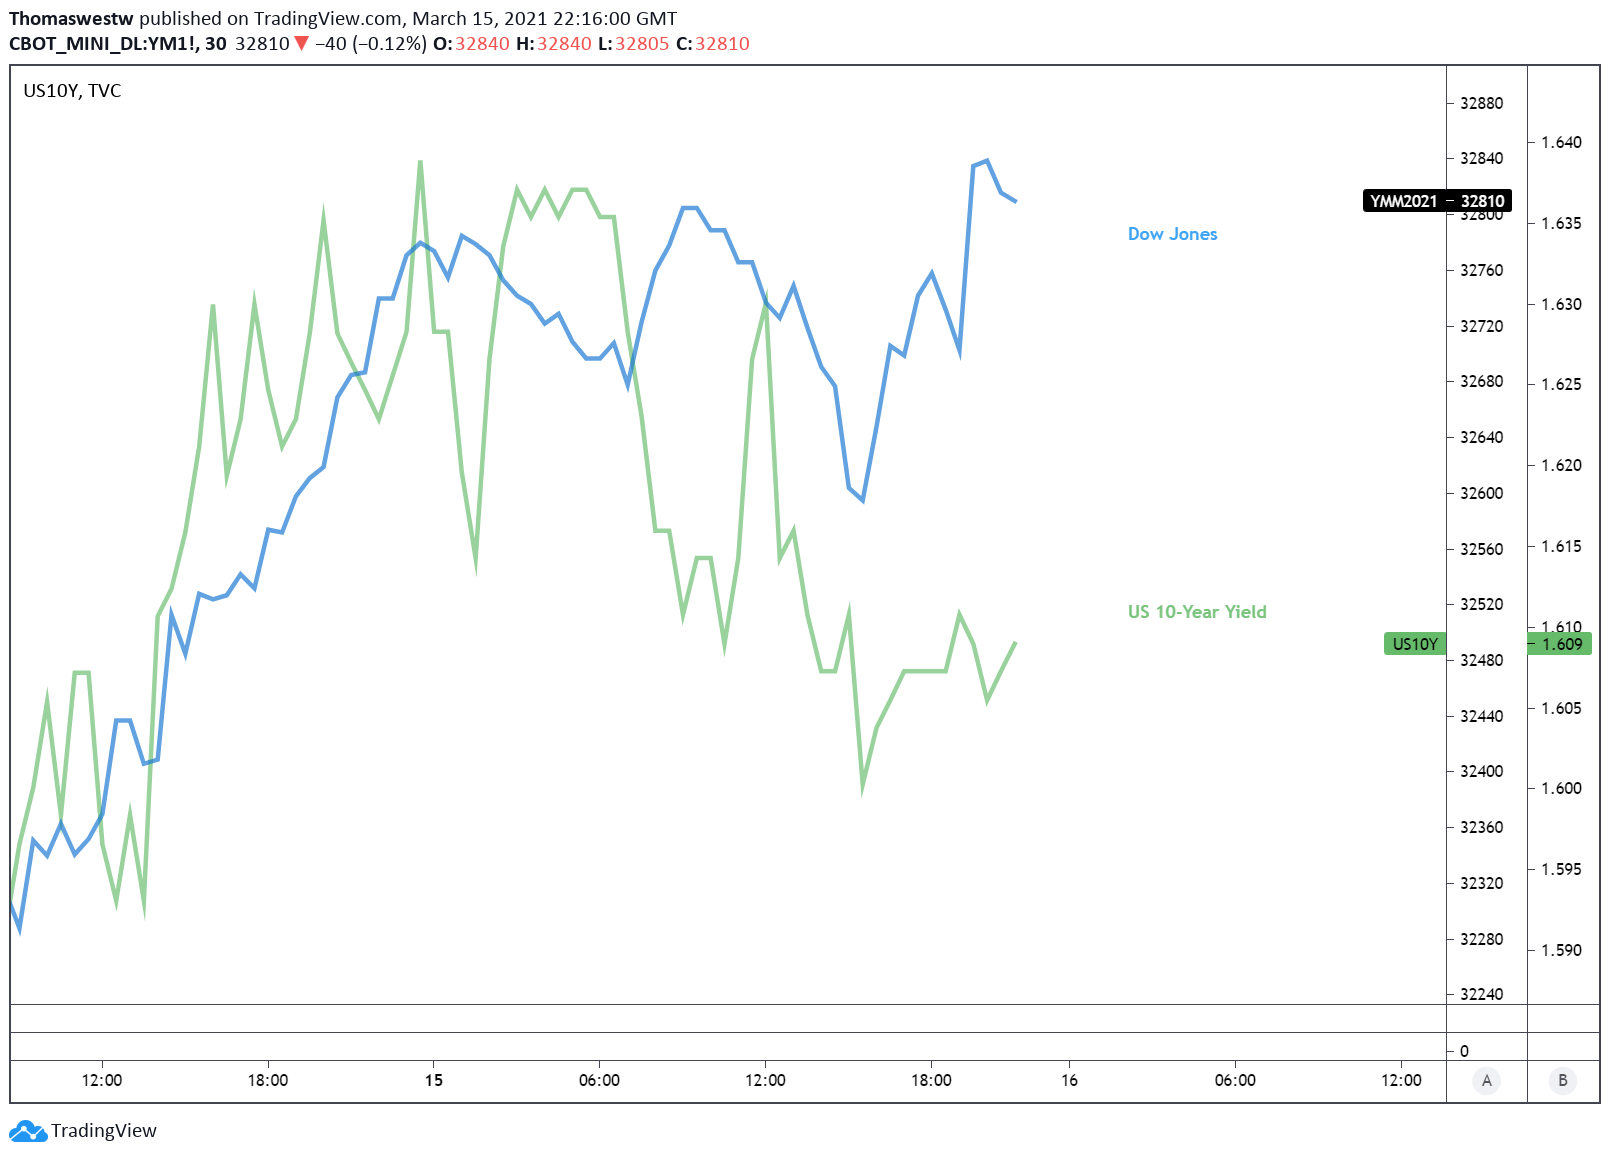
Chart created with TradingView

Tuesday’s Asia-Pacific Outlook
Asia-Pacific equity markets may move higher at the open after a mixed performance on Monday. Hong Kong’s Hang Seng Index (HSI) closed 0.33% higher. However, liquidity concerns pushed mainland China’s CSI 300 deep into the red, closing 2.15% lower. Elsewhere, Australia’s ASX 200 managed to gain 0.09%, while South Korea’s KOSPI losing close to a quarter of a percentage point.
Liquidity concerns in the world’s second-largest economy soured sentiment and helped push equities there lower despite better-than-expected economic data on Monday. The markets turned jittery as the People’s Bank of China (PBOC) was pushed to inject 100 billion Yuan into the markets.
Tuesday’s economic calendar highlights minutes from the most recent RBA meeting and industrial production data out of Japan. Hong Kong and South Korea will release unemployment data. Bank of Japan (BoJ) Governor Haruhiko Kuroda is set to give a speech at the FIN/SUM conference. Later this week, the BoJ will announce its interest rate decision. Some suspect that the central bank will announce a phasing out of its target on asset buying.
USD/JPY Technical Outlook
The US Dollar has seen a significant strengthening versus the Japanese Yen as the global reflation trade heats up, driving investors out of the safe-haven Yen. USD/JPY is up nearly 2.5% since the start of March, and upside momentum may drive prices higher. A Golden Cross formed this week, with the 50-day Simple Moving Average (SMA) crossing above the longer-term 200-day SMA.
The bullish signal may help propel prices higher after the bullish signal’s completion despite an already overbought reading on the Relative Strength Index (RSI). However, a pullback could see prices drop to the 78.6% Fibonacci retracement level. To the upside, the June multi-month high is now in focus at 109.851
USD/JPY Daily Chart
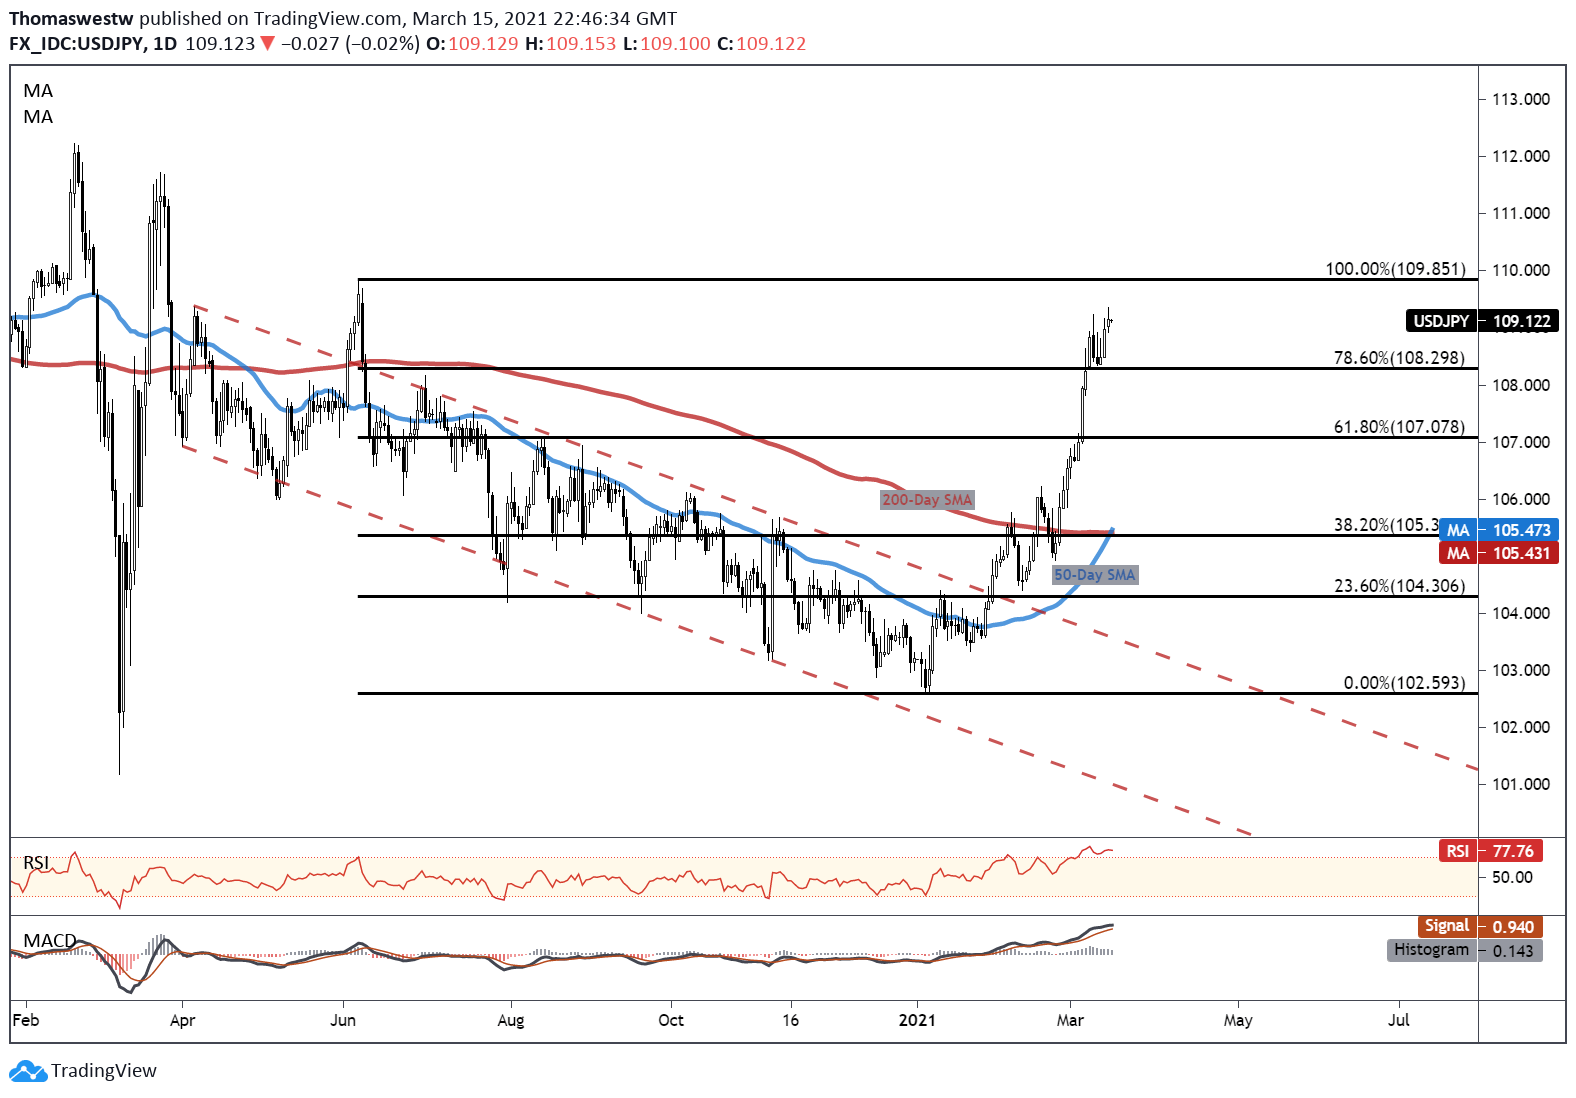
Chart created with TradingView
USD/JPY TRADING RESOURCES
- Just getting started? See our beginners’ guide for FX traders
- What is your trading personality? Take our quiz to find out
- Join a free webinar and have your trading questions answered
--- Written by Thomas Westwater, Analyst for DailyFX.com
To contact Thomas, use the comments section below or @FxWestwater on Twitter


