
US STOCKS OUTLOOK:
- S&P 500 and Nasdaq 100 suffer steep losses on Tuesday
- Rising recession risks amid weak economic data weigh on sentiment and hammer risk assets
- The FOMC decision will grab the spotlight on Wednesday
Trade Smarter - Sign up for the DailyFX Newsletter
Receive timely and compelling market commentary from the DailyFX team
Most Read: Central Bank Watch - Fedspeak, Interest Rate Expectations Update; FOMC Preview
U.S. stocks sold off Tuesday during regular trading hours as growing fears that the U.S. economy is headed for a hard landing soured the mood. Disappointing data, from consumer confidence to the International Monetary Fund's macroeconomic projections, reinforced the negative narrative, leading investors to head for the exits. Against this backdrop, the S&P 500 plunged 1.15% to 3,921, with the consumer discretionary cyclical sector leading the decline, a sign that growth-related concerns are catalyzing this leg down. The Nasdaq 100, meanwhile, sank 1.96% to 12,087, dragged down by a sharp sell-off in Amazon, Tesla and Meta Platforms shares.
Earlier today, the IMF sharply downgraded the global outlook, calling it "gloomy and more uncertain" and warning that the world economy could soon be on the brink of recession amid skyrocketing inflation, a worse-than-expected slowdown in China, the fallout from geopolitical conflict in Ukraine and tightening financial conditions.
The large decline in U.S. consumer confidence in July, which fell for the third consecutive month and hit its lowest level since February 2021, made matters worse for risk assets, prompting traders to trim equity exposure. If the U.S. consumer falters, household consumption could plummet, paving the way for a major economic downturn in the medium term, a scenario that would create additional headwinds for corporate earnings and the stock market as a whole.

Looking ahead, all eyes will be on the FOMC’s interest rate decision on Wednesday. The Fed is expected to raise borrowing costs by 75 bp to 2.25%-2.50%, delivering another aggressive hike in the ongoing battle to restore price stability. With the move fully priced-in, traders should focus on the statement’s forward-guidance and Chair Powell’s comments during his press conference.
Powell is likely to refrain from dropping any new hawkish bombshells, considering that inflation expectations have come down and CPI readings may start to soften in the coming months thanks in part to falling oil/gasoline prices, but this does not suggest that the central bank will signal a policy pivot; it is still too early for that. However, the absence of further hawkish surprises may help reduce extreme pessimism, allowing equities to stabilize, although earnings and the evolution of economic activity may prove more important for sentiment in the near term.
| Change in | Longs | Shorts | OI |
| Daily | 1% | -1% | 0% |
| Weekly | 15% | -13% | -1% |
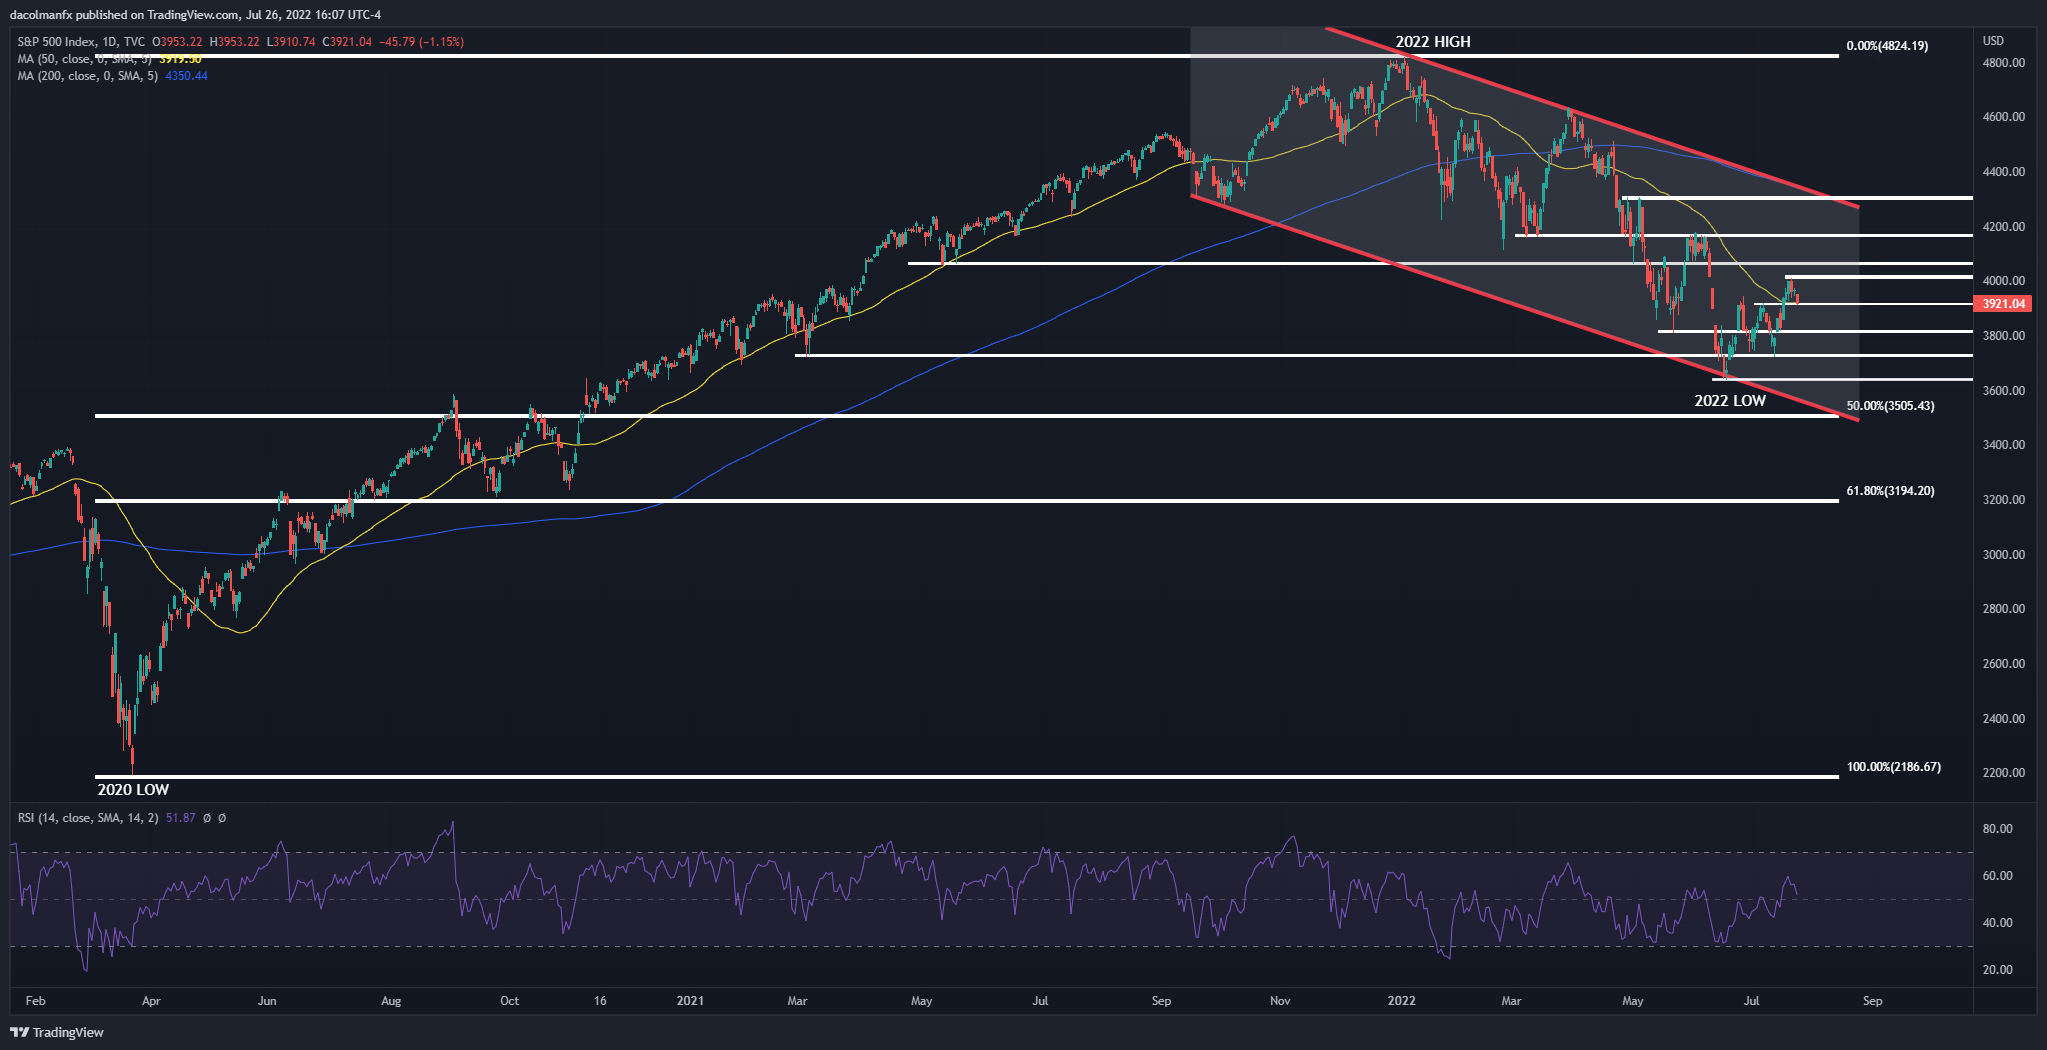
S&P 500 TECHNICAL ANALYSIS
After a flat performance at the start of the week, the S&P 500 suffered heavy losses on Tuesday, but managed to remain above the 50-day simple moving average near 3,920, a key technical support. If prices manage to rebound off this floor in the coming sessions, initial resistance appears at 4,015, followed by 4,065.
On the flip side, if sellers retain control of the market and push the index below the 3,920 barrier, bearish momentum could accelerate, setting the stage for a move towards 3,815. On further weakness, the focus shifts down to 3,725.
S&P 500 TECHNICAL CHART