


GOLD, XAU/USD, RUSSIA, REAL YIELDS, FED - Talking Points
- Gold has been moving sideways as sanctions fallout continues
- Real yields are inching higher on Fed action lowering inflation pricing
- With low volatility, will technical analysis provide XAU/USD direction?

Gold inched higher overnight on concerns of further sanctions against Russia from the EU. It was also reported that the London Metals Exchange (LME) had recently held discussions with stakeholders about the future of taking delivery of Russian metals.
It is believed that the LME will comply with any government regulation but will not go beyond that at this stage.
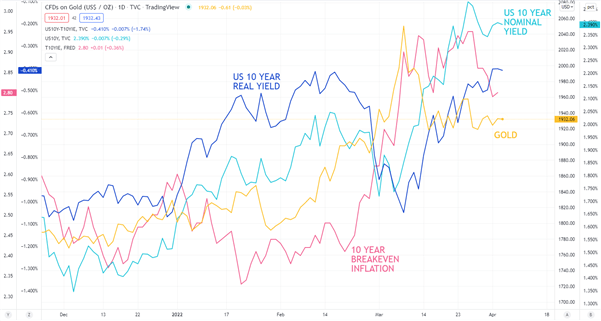
The backdrop for the precious metal remains challenging, with US real yields climbing higher. A higher real return from Treasury notes provides an interest-bearing alternative to the non-yielding yellow metal.
The recent push higher in real yields is the result of inflation expectations being lowered, as a result of the Federal Reserve appearing to get serious about tackling price pressures for consumers.
Until now, the market saw the Fed as being too dovish. Expectations for more aggressive tightening are growing, with only 6 Federal Open Market Committee (FOMC) meetings left in the year and 8 hikes being priced in, this implies 2 hikes of 50 basis-points (bp).
While inflation expectations have been lowered, nominal yields have been steady. The benchmark 10-year bond remains near 2.40%, not far from the recent 3-year peak of 2.56%.
GOLD AGAINST US 10-YEAR REAL YIELD,US 10-YEAR NOMINAL YIELD, US 10-YEAR BREAKEVEN INFLATION
Introduction to Technical Analysis
Moving Averages
Recommended by Daniel McCarthy
GOLD TECHNICAL ANALYSIS
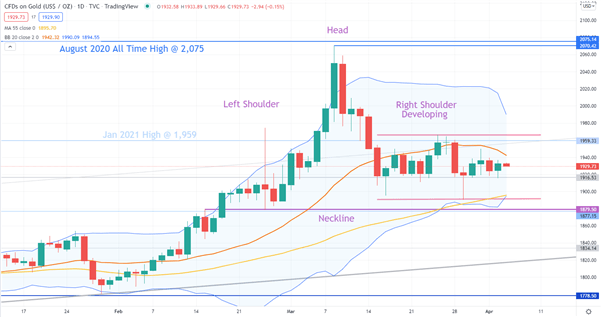
In March, the gold price rallied to a peak of 2,070.42 but fell short of the all-time high of 2,075.14 seen in July 2020 creating a Double Top. In the bigger picture, this failure to break higher could be a bearish signal.
A potential bearish Head and Shoulder pattern is emerging and a break below the neckline at 1,875.50 may confirm the pattern.
The price is currently consolidating in a tight range of 1,892 – 1965 as the right shoulder is developing. These two levels are potential support and resistance respectively.
This consolidation is bringing volatility lower as illustrated by the narrowing of the width in 20-day Simple Moving Average (SMA) based Bollinger Band.
The price is currently between the 20 and 55-day SMAs, further suggesting a range trade environment might persist for now.
--- Written by Daniel McCarthy, Strategist for DailyFX.com
To contact Daniel, use the comments section below or @DanMcCathyFX on Twitter


