


GOLD, XAU/USD, US DOLLAR (DXY), FED, UKRAINE, YIELDS - Talking Points
- Gold has raced up as markets get jittery over Ukraine developments
- Fed rate hike expectations fluctuate with conflicting jawboning from officials
- Lower yields and rising investment risks boosted gold. Can XAU/USD keep going?

Gold shot higher on Friday as the markets erupted in the aftermath of Thursday’s record-breaking US CPI number and escalating geo-political tensions around the Ukraine border.
The US 10-year Treasury note is yielding about 1.95%, notably lower than the high seen on Friday at 2.06%. The Treasury curve is similarly seeing lower returns.
Government bonds around the globe have been bought as investors rush to more secure securities, driving yields lower
This has seen real yields push further into negative territory, with US 10-year real yields now at -0.48%, lower than -0.37% seen on Friday. Real yields are calculated by subtracting from the nominal return the market-priced inflation rate for the given tenure.
This is supportive for gold prices as the alternatives to the precious metal become less attractive.
On Sunday US time, San Francisco Federal Reserve Bank President Mary Daly re-iterated her comparatively dovish stance toward impending rate hikes, helping yields move lower.
Her comments were in stark contrast to those made by St. Louis Fed President James Bullard on Friday, where he called for 100 basis points worth of hikes within the next 3 FOMC meetings.
The White House announced on Friday that Russia could invade the Ukraine at any moment, and this sent markets into a spin. Risk assets sold off and safe havens were sought after. Gold rallied at the same time as the US Dollar was going higher.
100,000 troops may sound like a large number to be amassing on the border, but some military strategists point out that it is not enough to invade, conquer and occupy a country the size of the Ukraine.
It would be possible if the population being invaded was sympathetic to the cause, though the dissemination of pro-Russian material has been interrupted. Strategists point to this being one of the objectives of the rhetoric coming from Western nations.
Aside from any human cost of life, the economic cost of a war in the region will be detrimental to all sides involved. It is being reported that US intelligence agencies are of the belief that there are plans to send another 75,000 troops.
It remains to be seen if the situation will deteriorate further.
If tensions continue to escalate, this could be supportive of further advances for the yellow metal.
Introduction to Technical Analysis
Moving Averages
Recommended by Daniel McCarthy
GOLD TECHNICAL ANALYSIS
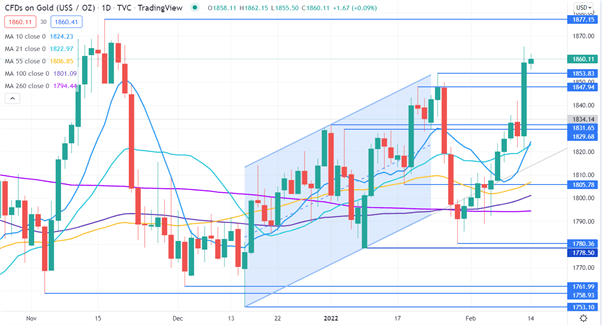
Gold rejected a move below an ascending trend line and resumed trading above all short, medium and long-term simple moving averages (SMA).
The press lower held above the previous low of 1778.50 to make a low of 1780.36 and these levels may continue to provide support.
Closer by, support might also be the pivot points of 1853.83, 1847.94, 1831.65, 1829.68 and 1805.78.
A bullish triple moving average (TMA) formation requires the price to be above the short term SMA, the latter to be above the medium term SMA and the medium term SMA to be above the long term SMA. All SMAs also need to have a positive gradient.
With the 10-day SMA crossing the 21-day SMA, conditions have been met for a bullish TMA. Using any 3 SMAs on the chart, the requirements for a TMA will be fulfilled. It should be noted though that past performance is not indicative of future results.
Resistance could be at the November peak of 1877.15. Trading above that level will be the highest since June last year.
--- Written by Daniel McCarthy, Strategist for DailyFX.com
To contact Daniel, use the comments section below or @DanMcCathyFX on Twitter


