


GOLD, XAU/USD, US DOLLAR (DXY), FED, FOMC, YIELDS - Talking Points
- Gold was hosed down by rising US yields after the FOMC meeting
- The US Dollar bounced on the hawkishness with rate hikes confirmed
- With the Fed now focused on the inflation fight,how malleable is XAU/USD?

Gold moved down 1.5% after the Federal Open Market Committee (FOMC) meeting of the Federal Reserve delivered on hawkish expectations.
Before the meeting, gold had benefitted from rising tensions in the Ukraine and the possibility of the Fed moving too quickly on tightening policy, hindering growth and the returns on growth assets.
The aftermath of the meeting has seen bond yields move higher and the US Dollar appreciate, both undermining gold.
The equity market response initially saw an aggressive selloff, but it then steadied before falling further in the overnight futures market.
Federal Reserve Chairman Jerome Powell appeared to give clarity that the end of asset purchases and a rate hike will be happening at the March meeting. However, uncertainty remains around the pace of tightening and when the Fed’s balance sheet will start to be reduced.
The 2-year Treasury yield continues its’ climb north, trading 13 basis points higher to be near 1.17%. This moved accelerated after a response to a question from Powell in the post meeting press conference, that he wouldn’t rule out a hike at every meeting this year.
Yields across the curve were all higher but most notable was the jump in real yields. The 10-year real yield went 10 basis points higher to -0.53%.
Although it is still negative, it is going in the direction that may eventually offer a more attractive return than gold, with the nominal yield on the 10-year Treasury note now at 1.85%.
It seems that the market now believes that the Fed is serious about tackling inflation. It is inflation expectations that might continue to be a driving factor for gold.
The increase in yields helped to boost the US Dollar with the DXY index 0.54% higher on the day. With gold down around 1.5%, it highlights the vulnerability of the yellow metal to rising interest rates.
Hot on the heels of the FOMC meeting will be GDP and jobs numbers from the US later today.
Trading Strategies and Risk Management
Bollinger Bands®
Recommended by Daniel McCarthy
GOLD TECHNICAL ANALYSIS
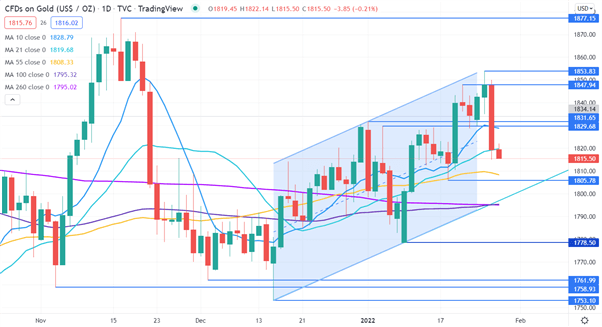
Gold has been in a 1753.10 – 1877.15 range since October last year. Since making a low in December, it has traded within an ascending trend channel.
The recent break-down went below short-term simple moving averages (SMA) but remains above medium and long-term SMAs. This could suggest that short-term momentum has turned bearish but medium and long-term momentum might remain intact for now.
Resistance could be at the pivot points and previous highs of 1829.68, 1831.65, 1847.94, 1853.83 and 1877.15.
On the downside, support could be at the pivot points and previous lows of 1805.78, 1778.50, 1761.99, 1758.93 and 1753.10.
--- Written by Daniel McCarthy, Strategist for DailyFX.com
To contact Daniel, use the comments section below or @DanMcCathyFX on Twitter


