


US-CHINA TRADE DEAL, STOCKS, SHANGHAI COMPOSITE, HANG SENG INDEX – Talking Points:
- Stocks in Shanghai, Hong Kong fall ahead of US-China trade deal signing
- Slim “phase 1” deal may be priced in already, hopes for “phase 2” modest
- Technical positioning warns that Chinese stock indexes might be topping
The markets’ attention has been piqued as the US and China prepare to sign a ‘phase one’ trade deal after 18 months of combative rhetoric and tit-for-tat tariff hikes. The accord envisions reversing some recent increases in duties on Chinese imports and cancelling plans for others in exchange for larger purchases of US agricultural exports, such as soybeans.
One might think that thawing relations between Washington and Beijing ought to be good news for Chinese stocks considering the damage that the trade war has done to the East Asian giant’s economy. And yet, benchmarks for on- and offshore equities – the Shanghai Composite and the Hong Kong’s Hang Seng Index – are falling as the agreement’s realization draws closer.
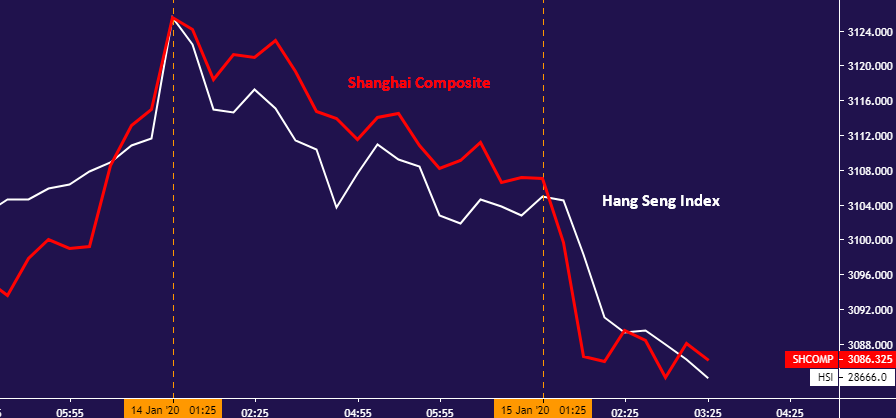
Shanghai Composite, Hang Seng Index 15min chart created with TradingView
Both indexes have trended broadly lower since the beginning of 2018 as the US-China trade war escalated and dutifully rallied in the fourth quarter of 2019 as an initial trade deal – however limited – began to appear likely. Put another way, seemingly counter-intuitive price action noted over the past 48 hours is a departure from the way that Chinese shares have generally responded to the trade conflict narrative.
Why the change? A “buy the rumor, sell the fact” explanation seems compelling. The narrow scope of the ‘phase one’ agreement has been priced in already, whereas the issues yet to be settled – property rights enforcement, technology transfer, industrial policy, market access – are far thornier. This, along with the onset of the US presidential election, might make any progress on ‘phase two’ a distant proposition.

TECHNICAL ANALYSIS OF CHINESE STOCKS – HANG SENG INDEX, SHANGHAI COMPOSITE
Technical positioning seems to cautiously reinforce this narrative. A daily chart of the Hang Seng Index is showing negative RSI divergence as prices test resistance at the top of a rising channel guiding them higher since mid-August. This warns of ebbing upside momentum, which may precede a reversal lower. A break below support in the 27949-28091 area would serve as confirmation.

Hang Seng Index daily chart created with TradingView
A similar picture has emerged for the Shanghai Composite. Here too, negative RSI divergence speaks to fading upward conviction as prices trace the outlines of a bearish Rising Wedge chart pattern. Confirmation of reversal on a daily close below resistance-turned-support at 3048.48 might pave the way to test support set from January 2019.

Shanghai Composite daily chart created with TradingView
SHANGHAI COMPOSITE, HANG SENG INDEX TRADING RESOURCES
- Just getting started? See our beginners’ guide for FX traders
- Having trouble with your strategy? Here’s the #1 mistake that traders make
- Join a free webinar and have your questions answered
--- Written by Ilya Spivak, Currency Strategist for DailyFX.com
To contact Ilya, use the comments section below or @IlyaSpivak on Twitter


