


USDINR, Rupee, US-India Trade War Talking Points
- Indian Rupee may depreciate if US-India trade tensions heat up
- Trump Indian tariff threats could speed up the RBI easing cycle
- USDINR may clear key descending trend line from 2018 ahead
Trade all the major global economic data live as it populates in the economic calendar and follow the live coverage for key events listed in the DailyFX Webinars. We’d love to have you along.
US-India Trade Tensions May Heat Up
The USDINR could reverse the dominant downtrend from October 2018 if trade tensions between the United States and India escalate in an already anxious market environment. On June 1, US President Donald Trumpended preferential treatment status for about $6b worth of goods purchased duty-free from India. This was partially as a result of aiming to reduce the nation’s trade deficit with the world.
Narendra Modi, India’s Prime Minister, retaliated on June 15 when he announced that the nation will be raising tariffs on 28 types of goods imported from the US. Items that are to be taxed include agricultural goods such as apples, almonds and walnuts. For reference, in the US-China trade war, the latter’s retaliation mainly targeted the former’s agricultural sector, a key segment of Trump’s supporters.
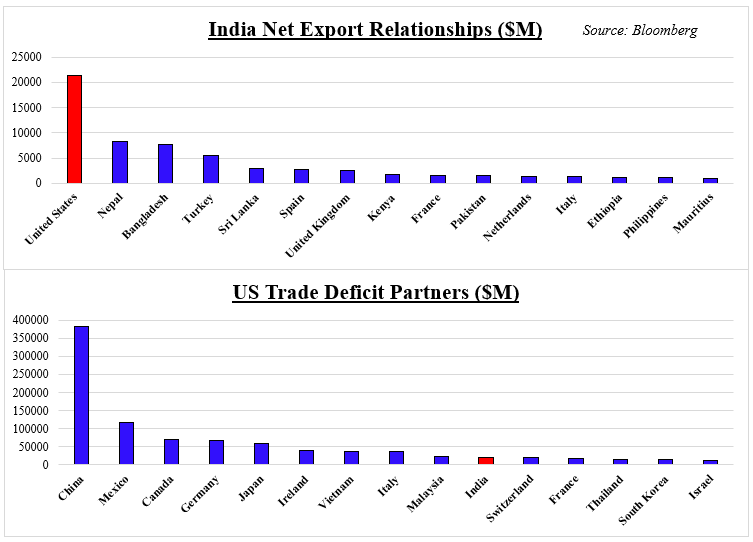
This could risk further retaliation from the world’s largest economy towards India and the latter seems more vulnerable to its tariffs. Looking at the chart below, India’s largest source of a positive net-export relationship is the US, dwarfing the second-largest, Nepal, by almost threefold (about 2.6 times bigger). Meanwhile, the US has a small trade deficit with India, at least relative to nations such as China, Mexico and Canada.
Indian and US Trade Relationship
How to Trade Emerging Market Currencies, Such as the Indian Rupee
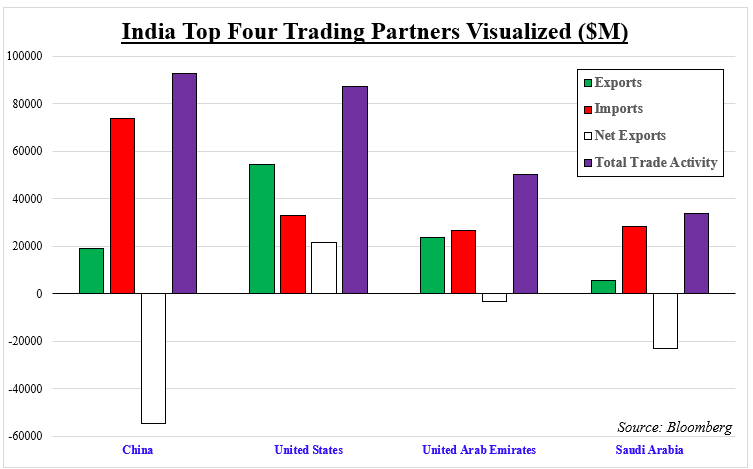
If we look at India’s top four trading partners using overall activity on the next chart below, the US stands in second place next to China. But, it is the only nation of the four to yield a trade surplus with. Positive net-exports adds to GDP. In short, this means that if Trump raises tariffs on Indian imports, this may in the long-run shrink their surplus as consumers purchase fewer items which hurt economic activity, all else being equal.
To put this into the perspective of how this may impact monetary policy and the Rupee, the Reserve Bank of India cut rates for a third consecutive meeting earlier this month. This left their key policy rate at 5.75%, down from 6.50% at the end of 2018. The central bank also paved the way for more easing to come due to uncertainty around the outlook for inflation.
US-India trade tensions could accelerate this easing cycle, especially if GDP is weaker than it is reported, and risk aversion results in capital outflows. According to The Economist, India’s former Chief Economic Adviser Arvind Subramanian argued in a paper that the country’s GDP figures have been “greatly overstated”. Rather than averaging 7% growth from 2011 – 2017 and outpacing China, he thinks it is closer to 4.5%.
India Top Trading Partners
USDINR Technical Analysis
In the medium-term, this could reverse the dominant downtrend witnessed in USDINR since October. Looking at the Indian Rupee daily chart below, we can see that the pair has been guided lower by a couple of descending resistance lines (two pink lines). A clear technical barrier breached back in March was the rising trend line from April 2018, paving the way for further declines in the long-run.
However, since the middle of March, a rising support channel took USDINR higher to retest the descending resistance lines from the end of last year. This is a clear psychological barrier that if breached, opens the door to testing 70.58, the May peak. In the medium-term, extending an uptrend requires climbing above the April 2018 trend line which may reestablish itself.
As markets anxiously await the possibility of the US slapping tariffs on India, we could see USDINR fall in the near-term. Especially if the Fed turns more dovish in June. In that case, keep an eye on support between 69.04 and 69.13. If that is taken out, it exposes the next key psychological barrier between 68.31 and 68.39. These are the July 2018 lows.
For updates on the Indian Rupee and USDINR, you may follow me on Twitter here @ddubrovskyFX
USDINR Daily Chart

Chart Created in TradingView
FX Trading Resources
- Just getting started? See our beginners’ guide for FX traders
- Having trouble with your strategy? Here’s the #1 mistake that traders make
- See how currenciesare viewed by the trading community at the DailyFX Sentiment Page
--- Written by Daniel Dubrovsky, Currency Analyst for DailyFX.com
To contact Daniel, use the comments section below or @ddubrovskyFX on Twitter


