Fundamental Forecast for USOIL: Bullish
Talking Points:
- Oil market calendar spreads show backwardation hinting that supply cuts are working
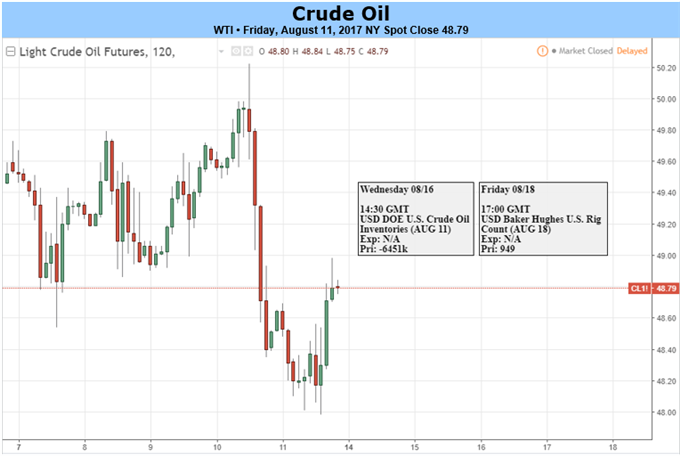
- Crude oil set for weekly drop as IEA trims demand estimates
- Oil calendar spreads shifting from Contango to Backwardation favoring falling concerns
- Per Baker Hughes, US Oil Rig count rises by 3 rigs to 768 total active US oil rigs
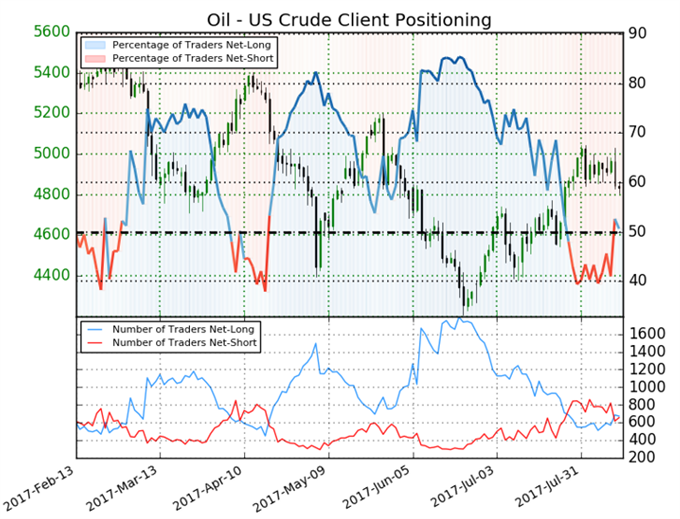
- IGCS showing increase in retail long oil positions, contrarian view favors further price drop
$50 per barrel of West Texas Intermediate Crude seems to be a tough nut to crack. While the market has provided justification for trading in the $45-$50 price range, it remains to be seen whether or not we could see $50 per barrel soon act as support. One reason that we’ve argued this could be difficult in the near term is that producers are increasing hedges to lock in the near $50/barrel price tag when they bring their oil to market, which argues that we’ll likely continue to see more supply.
Friday saw the price of Crude Oil trade at the lowest levels since late July, but the price pattern (discussed more below) appears to show that we may be retracing the uptrend before resuming higher as opposed to breaking down. Commodities have a few things going right for it, and Oil is no different. The weaker dollar, which was further enforced on Friday by the fifth straight miss in US CPI (1.7% y/y vs. exp 1.8% y/y), geopolitical tensions from North Korea and President Trump, as well as active attempts from OPEC to reduce supply appear to be in the best long-term interests of Oil Bulls.
One method to validate the increasing signs of success from OPEC’s supply curbing is the development of backwardation. Backwardation signals that demand is beginning to surpass supply as the discount on immediate crude would turns into a premium. We have covered this development on this week’s FX Closing Bell webinars, but it helps to show the object from OPEC is showing success. A key objective of OPEC was to reduce supply to the five-year average in stockpiles, which has not been accomplished yet showing that further supply reduction is likely and could further support the price of Oil.
The concern that remains is that the rise in price has been led more by the rise in demand than the cut in supply. While the supply curbs appear to be doing there job, albeit slowly, any reduction in demand could likely shift the outlook from Bullish to Bearish in rather short order.
We are beginning to see fundamental support in the Oil market. Click here to see our Q3 forecast on what outcomes we're watching!
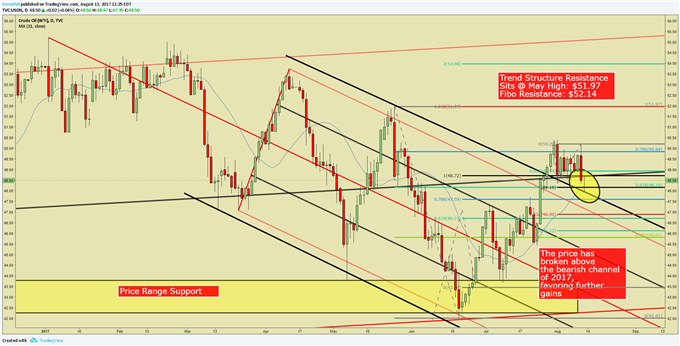
On the price chart below, you can see that Crude Oil price broke above the chart resistance and bearish price channel that has framed price action for most of 2017. We will look for the price to hold above $47/bbl in WTI to validate that there is latent bullish momentum that could keep price supported near and above $50. One development in the options market that could produce a price ceiling is a further increase in put positions by E&P firms. Puts are options that give the buyer a right to sell at a higher price and are popular among producers. Therefore, if major drillers are amassing hedges, it could act as a price ceiling that will make the lower half of $50/bbl hard to crack. Put accumulation would also signal that supply will remain relatively high.
Crude Oil price holds above strong support from confluence of levels near $48.20

Chart Created by Tyler Yell, CMT
Next Week’s Data Points That May Affect Energy Markets:
The fundamental focal points for the energy market next week:
- Monday 2:00 PM ET: EIA Drilling Productivity Report
- Monday 10:00 PM ET, Aug. 13: China releases commodity production data including oil, coal, steel, aluminum and power output as well as crude processing at 10am in Beijing
- Tuesday 4:30 PM ET: API weekly U.S. oil inventory report
- Wednesday 10:30 AM ET: EIA Petroleum Supply Report
- Wednesday 2:00 PM ET : China National Petroleum Corp. releases China and global energy demand outlook at 2 p.m. in Beijing
- Fridays 1:00 PM ET: Baker-Hughes Rig Count at
- Friday 3:30 PM ET: Release of the CFTC weekly commitments of traders report on U.S. futures, options contracts
Crude Oil IG Client Sentiment Highlight: Contrarian view suggests further drop in price

The insight derived from this sentiment analysis on Oil is that traders are increasing their long exposure (blue line on bottom half of chart) while reducing their short coverage likely due to the recent fall in price. Considering this, the sentiment picture favors further price pressure.
-TY


