


Chinese Yuan Talking Points:
- The Yuan has displayed some significant strength so far this morning with USD/CNH testing below the psychologically important level of 7.0000.
- A bit of skepticism has shown around the potential for a ‘phase one’ trade deal between the US and China, with an earlier article in the South China Morning Post indicating that the Chinese delegation wanted to see more give from the US side ahead of upcoming discussions.
Another week, another item on the headlines in the continued trade war between US and China. While the backdrop was primed for bullish breakouts in US equities last week with both a softer FOMC and positive developments on the US-China trade-front, prices are pulling back so far today as some opacity has shown in the ongoing dispute.
Just last night hope remained for a continued thawing of relations as Chinese President Xi Jinping gave a speech in Shanghai. At the China International Import Expo, Xi spoke of the need for ‘consultation and cooperation’ to resolve international disputes, going on to say ‘the door that China is opening will only open further and wider.’
This isn’t the first time the Chinese President has used this phraseology, as it resembles similar prior pledges going back to last year and reiterated again in early-August. This helped to keep the risk trade in order with S&P 500 futures re-testing the record high earlier this morning. But that’s when another item began to show, this time indicating that China wasn’t yet ready for a ‘phase one’ agreement until the US makes firmer commitments to lifting tariffs. In short order, US equities dropped and have continued heading-lower through the US open; and USD/CNH has put in an aggressive move of weakness as the pair has crossed below the 7.0000 figure for the first time in more than two months.
USD/CNH Daily Price Chart

Chart prepared by James Stanley; USDCNH on Tradingview
This US Dollar weakness comes at odds with a number of other major currency pairs. As looked at earlier this morning, the US Dollar has continued to bounce. In DXY, price action is testing a key zone of resistance, the same area that helped to hold the highs last week around the FOMC rate decision.
US Dollar Four-Hour Price Chart
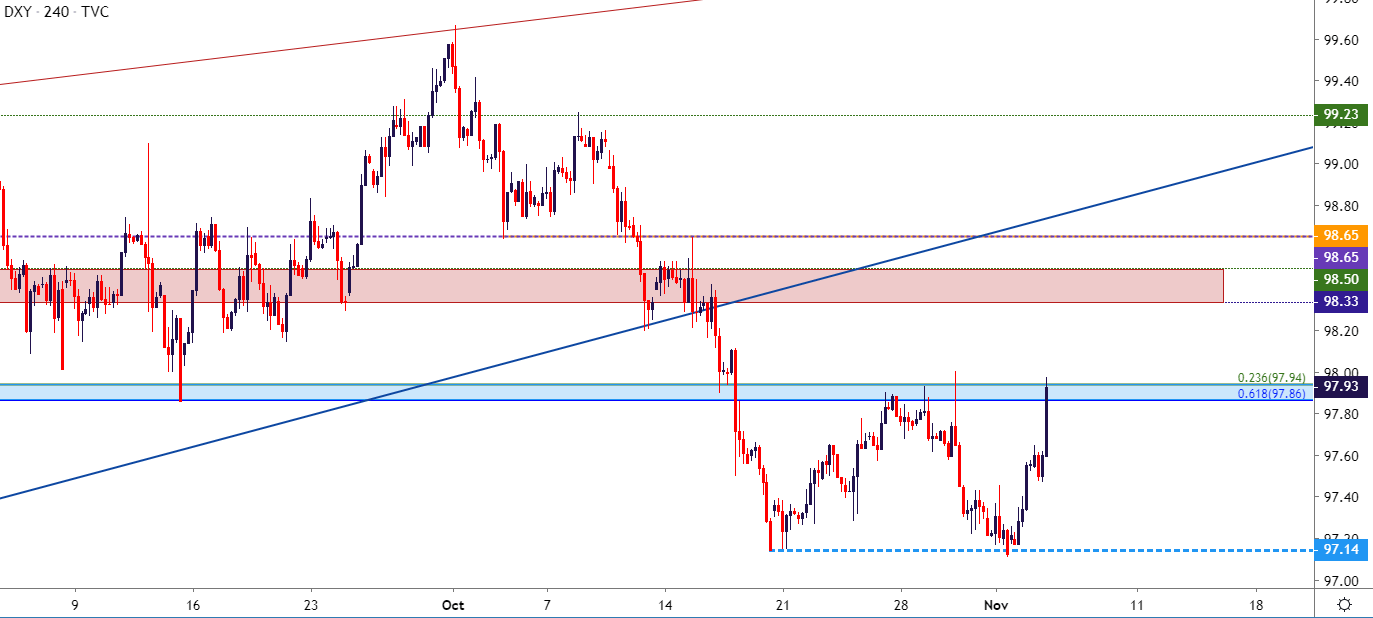
Chart prepared by James Stanley; US Dollar on Tradingview
This could make for an interesting backdrop around USD/CNH as a big support test is currently underway. The 2016 and 2017 swing-highs plot around the 6.9871 level and just a little higher, around 6.9955 is the 38.2% retracement of the 2019 bullish move. This offers an area of confluence that can make topside swing strategies as attractive, particularly for those looking to implement long-USD strategies.
USDCNH Weekly Price Chart
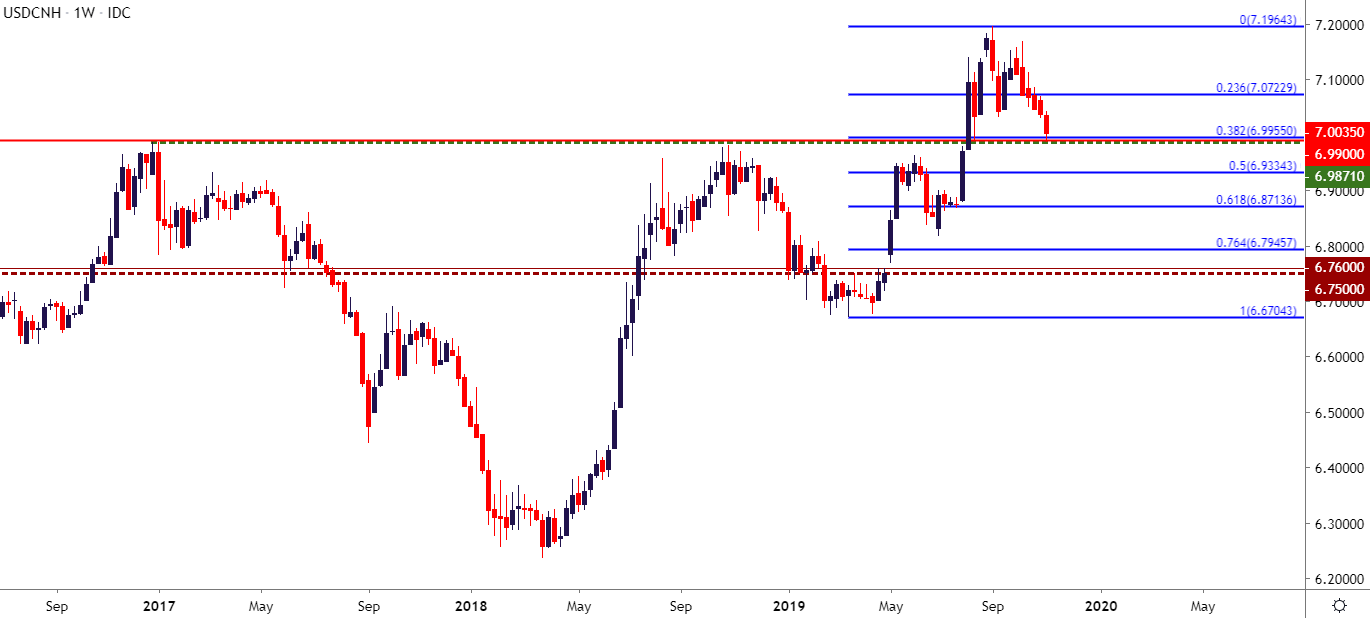
Chart prepared by James Stanley; USDCNH on Tradingview
The big question at this point is whether this diminishing optimism around a near-term trade deal might continue to dent the risk trade, allowing for a deeper drop in US equity indices after last week’s lurch up to fresh all-time-highs. In the S&P 500, prices were trading on helium so far in November so there aren’t many nearby support points to use for staging bullish strategies. There’s the post-FOMC swing-high around 3056 that may soon become usable, after which the prior all-time-high around 3026 comes into view. Below this, the 3k level remains of interest; but if price action breaks-below that, something else is likely going on and that bullish bias on US equities will likely no longer be as attractive.
S&P 500 Two-Hour Price Chart
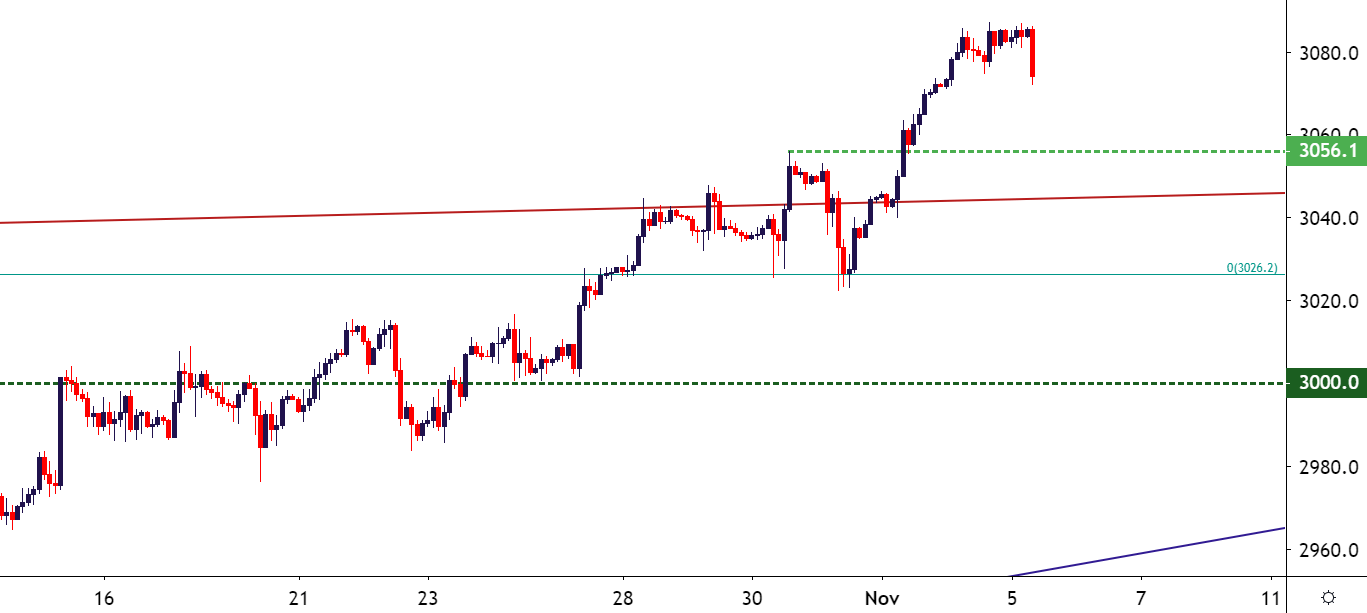
Chart prepared by James Stanley; SPX500 on Tradingview
To read more:
Are you looking for longer-term analysis on the U.S. Dollar? Our DailyFX Forecasts have a section for each major currency, and we also offer a plethora of resources on Gold or USD-pairs such as EUR/USD, GBP/USD, USD/JPY, AUD/USD. Traders can also stay up with near-term positioning via our IG Client Sentiment Indicator.
Forex Trading Resources
DailyFX offers an abundance of tools, indicators and resources to help traders. For those looking for trading ideas, our IG Client Sentiment shows the positioning of retail traders with actual live trades and positions. Our trading guides bring our DailyFX Quarterly Forecasts and our Top Trading Opportunities; and our real-time news feed has intra-day interactions from the DailyFX team. And if you’re looking for real-time analysis, our DailyFX Webinars offer numerous sessions each week in which you can see how and why we’re looking at what we’re looking at.
If you’re looking for educational information, our New to FX guide is there to help new(er) traders while our Traits of Successful Traders research is built to help sharpen the skill set by focusing on risk and trade management.
--- Written by James Stanley, Strategist for DailyFX.com
Contact and follow James on Twitter: @JStanleyFX


