


Talking Points
-Elliott Wave flat patterns correct sideways and tend to be shallow
-Gold prices appear to have just finished an expanded flat correction
-While prices are above $1247, gold prices may continue to break higher
In Elliott Wave Theory, flat patterns are consolidation moves that are designed to eat up more time than price. Flat patterns tend to be shallow retracements of the previous trend and when finished, can lead to a breakout higher.
Today, we will study gold prices as an example of a running flat pattern.
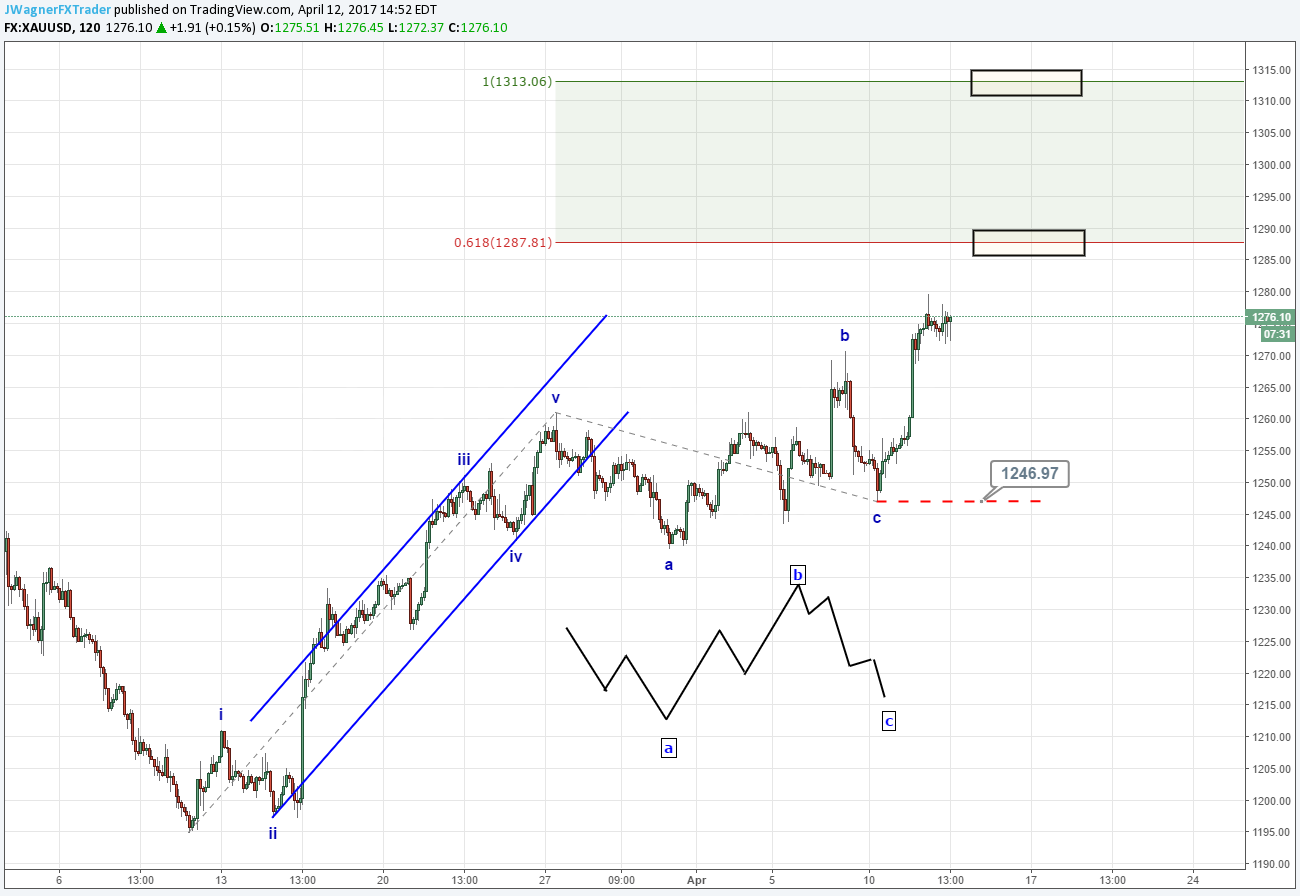
Gold prices have been steadily rising for the past 30 days increasing nearly 7%. Prior to the recent break higher, gold prices were consolidating sideways in a very shallow retracement.
The correction in the blue a-b-c clearly illustrates a three wave move. In Elliott Wave Theory, three wave generally form against the direction of the main trend. Therefore, a three wave pause after a strong run up fits into the Elliott Wave model.
There are some guidelines we can use when targeting the ending point of wave c in the flat. Many times, alternating wave have equality or Fibonacci relationships to one another. In this case, wave c would equal wave a near $1249. The low on April 10 came in at $1247.
Now that we have a corrective pattern identified, let us see how it fits into the bigger picture so we can estimate the next leg higher.
Prior to the blue a-b-c- running flat correction, we have an impulse move of five waves. Since this impulse began a new trend, we can look for another five wave move of Fibonacci proportion OR of equal wave measurement. The level where wave ‘c’ is 61.8% the length of wave ‘a’ is at $1289. The equal wave measurement is near $1313.
Therefore, our flat pattern remains valid and integral to this analysis so long as gold prices remain above $1247. Our near term targets of $1289 and $1313 fit within the longer-term analysis produced when we asked the question can gold prices rally with the Fed raising rates?
Interested in expanding your understanding of Elliott Wave Theory? Grab our beginners and advanced Elliott Wave guides where the various patterns are illustrated for you to review.
If you want to see Elliott Wave in action, then join Jeremy for his US Opening Bell webinars to discuss the current patterns for gold and other main markets.
Gold Price Intraday Chart
---Written by Jeremy Wagner, Head Trading Instructor, DailyFX EDU
Follow me on Twitter at @JWagnerFXTrader .
See Jeremy’s recent articles at his Bio Page.
To receive additional articles from Jeremy via email, join Jeremy’s distribution list.


