


Talking Points
-Dow Jones Industrial Average (DJIA) fails to follow Friday’s jump higher
-Citi Surprise Index and Fed rate hike expectations are falling which should keep the cost of capital cheap for the foreseeable future
-Wait for a break of the recent DJIA price range (18,668 topside; 18,295 downside)
Friday’s strength in Dow Jones Industrial Average has failed to follow through higher. This is becoming concerning that a correction of time and or price may continue with sideways and potentially lower trade over the next few days.
One catalyst for strength on Friday was the weaker than expected US jobs report. The weaker than expected reading pushed out rate hike probabilities. Rate hikes before the US presidential election creates uncertainty for DJIA and the market would likely sell off on such an event.
As my colleague Christopher Vecchio points out, even though the Citi Surprise Index is falling (suggesting weaker than expected data rolling in) and Fed rate hike probabilities falling, the inability of DJIA suggests weakness on the horizon. If the market can’t rally when it should, then absent a break to new highs, we’ll be on watch for deeper dips.
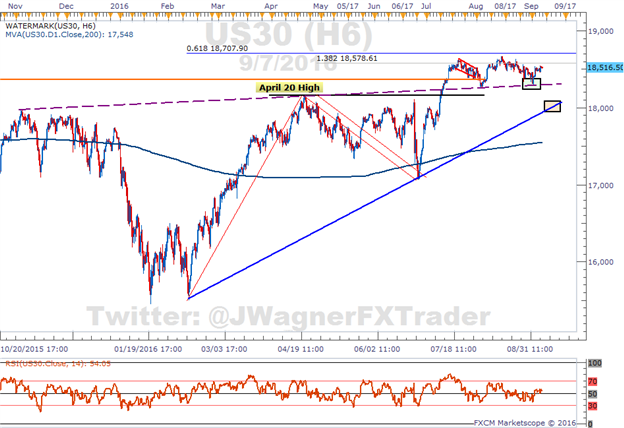
Chart prepared by Jeremy Wagner
From a technical perspective, we have a recent range established between the all-time high of 18,668 and Thursday’s low of 18,295. The Relative Strength Index (RSI) is stuck in the middle providing little clues at this moment as to a direction. Therefore, we’ll need to rely on price action for our next big clue of direction.
A break above is a bullish development and we would look for prices to accelerate higher towards 19,700. A break below 18,295 opens the door to the blue trend line which crosses near 18,000.
Interested in a longer term outlook for equities? Download our quarterly forecast here.
---Written by Jeremy Wagner, Head Trading Instructor, DailyFX EDU
Follow me on Twitter at @JWagnerFXTrader .
See Jeremy’s recent articles at his Bio Page.
To receive additional articles from Jeremy via email, join Jeremy’s distribution list.


