


Talking Points
-Dow Jones Industrial Average drives higher on Tuesday
-Dow Jones Sentiment suggests further gains
-Confluence of 3 points of technical resistance near Tuesday’s high
Dow Jones Industrial Average closed up over 200 points on Tuesday. The move higher pressed into a zone of resistance near 17,928. Though we think prices will eventually dip into support zone 2 identified in last week’s report, the wave structure allows for price to bump up to 18,340 and still be considered corrective.
In essence, we are looking for a downward corrective structure that eats up more time than price.
In the meantime, we look for clues about near term support or resistance.
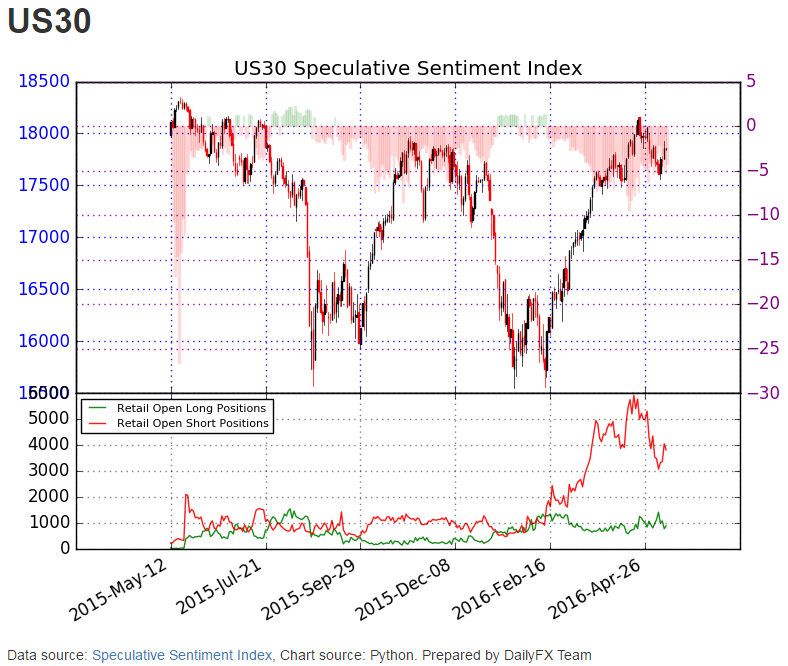
Starting with sentiment, the Speculative Sentiment Index shows the number of long positions are shrinking compared to levels yesterday (down 9%) and last week (down 32%). At the same time, the number of short positions are up 7% compared to yesterday and up 9% compared to last week. This divergence in shrinking longs and growing shorts suggests we may see prices pop higher.
Learn more about Speculative Sentiment Index with this 5 minute video.
A bump higher would clear technical resistance. There are 3 points of confluence near 17,928 on the US30 chart, a CFD which tracks the DJIA:
- Purple trend line
- 61.8% retracement of the April 20 to May 6 down trend
- Equal wave measurement from May 6 to May 9 high projected from the May 9 low

Therefore, a break and close above yesterday’s high would open the door to higher levels up to 18,340. Remember, this could be a ‘B’ wave which tends to be sucker waves. In this case, below 18,340 keeps the ‘B’ wave option on the table for an eventual retest towards 17,550 and possibly lower.
As a result, we are cautiously bullish on the short term. A shorter term trader may consider a breakout above Tuesday’s high, while targeting the April 20 high. The overnight low could be the risk near 17,830.
Below 17,830 and to the May 6 low of 17,550 becomes no man’s land. If price prints into that zone, we’ll await more clarity while anticipating an eventual dip to support zone 2.
The above is a shorter term forecast for Dow Jones. If you are interested in our Q2 2016 equities forecast, download it here.
We studied millions of live trades and produced a Traits of Successful Traders Research. Learn these discoveries with a free download.
Suggested Reading:
Dow Jones Report (May 6, 2016)
S&P 500 Jets Higher, Faces Test at Resistance (May 11, 2016)
---Written by Jeremy Wagner, Head Trading Instructor, DailyFX EDU
Follow me on Twitter at @JWagnerFXTrader .
See Jeremy’s recent articles at his Bio Page.


