


Interested in becoming a better trader? Check out the guide that DailyFX compiled from the traits that characterized the Most Successful Traders.
Talking Points:
- After Getting Closer To Its Third Standard Deviation NZD/CHF Retrace Back Inside Its Channel
- Technical Analysis Shows Further Pressure To The Downside
- Is NZD/CHF Still Good At Reflecting Investor’s Risk Aversion?
Medium-Term Technical Outlook:
Along the Trading Year, in 2016, NZD/CHF has only been priced above its three Standard deviations two times. Surprisingly, these two times were during this past month, when global uncertainty seemed to have ramped up again due to the unexpected results of the U.K. referendum to leave the EU. We say surprisingly because NZD/CHF been a good measure of global financial risk aversion, More on this in next section.
NZD/CHF 1 Hour Chart
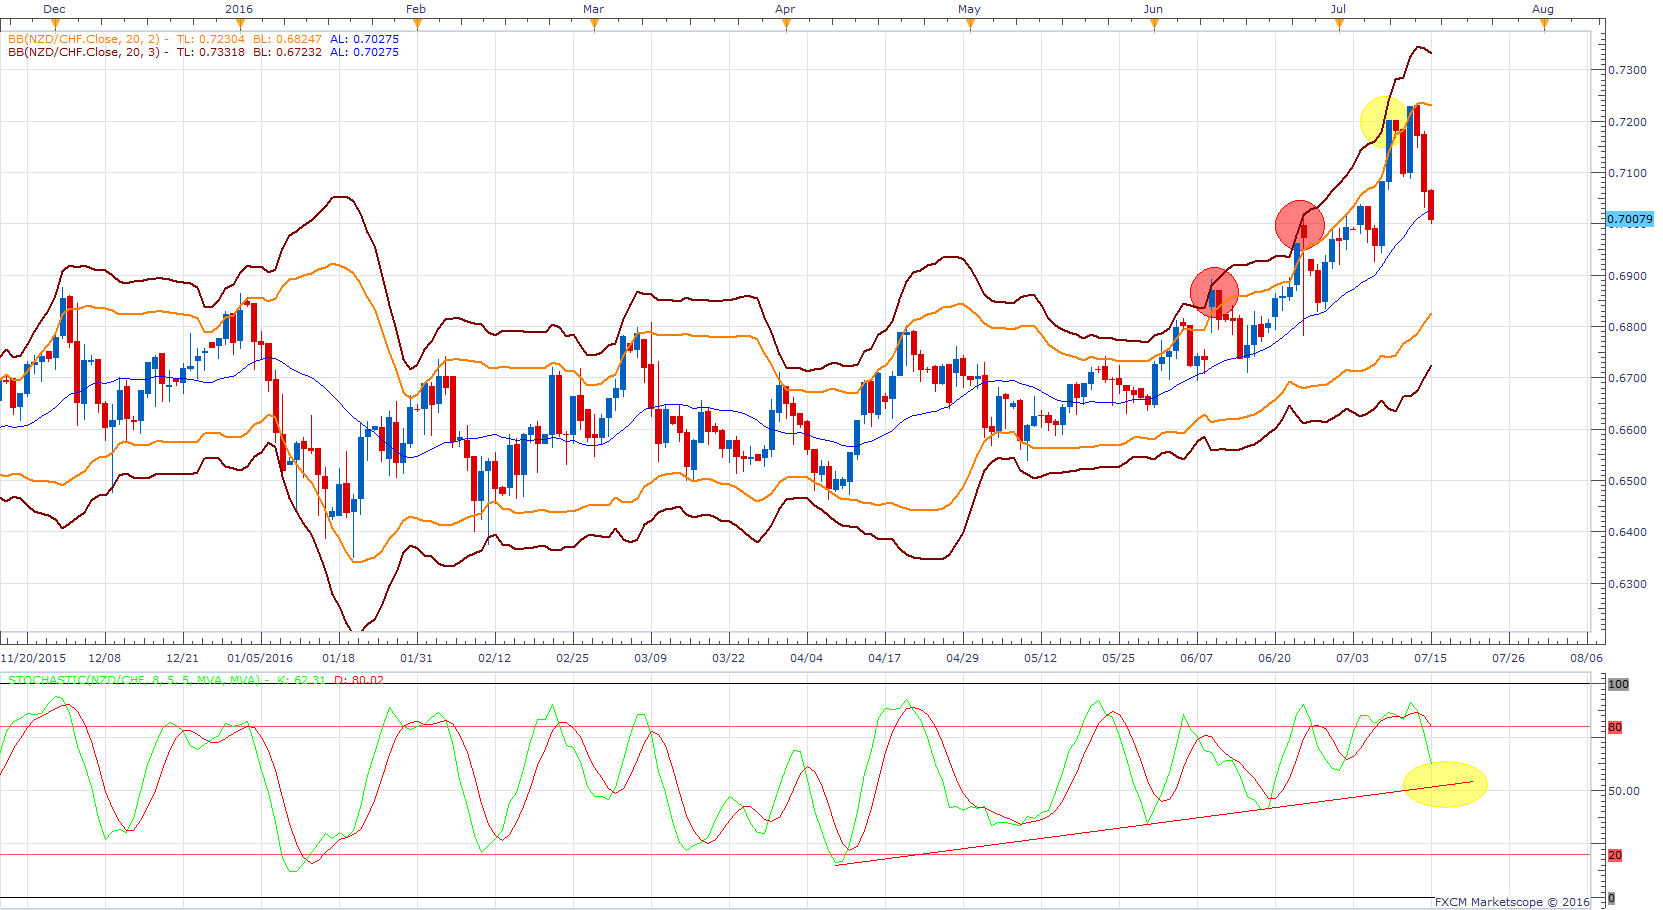
(Created Using Marketscope 2.0)
As depicted in the chart above, immediately after prices started trading above the three Standard deviations, NZD/CHF has retraced to the 20 DMA, Technical level that has proven to be good support on the current upside trend. As of right now, prices are sitting on the 20 DMA support line, this comes after prices got significantly close to the three standard deviation on last week’s last trading session.
Even though we are already on support levels shown by the 20 DMA, the stochastic oscillator is telling us another story, as since the start of this upside trend, this oscillator has been registering higher levels, levels that have been respected by price action. Therefore, if price action has been validating this behavior, we could continue to see further downward pressure in the cross.
Longer-Term Technical Outlook:
As mentioned in the opening paragraph NZD/CHF is a great instrument if you are interested in knowing whether the global economy is taking on more risk or investors are starting to be risk averse.
NZD/CHF Weekly Chart
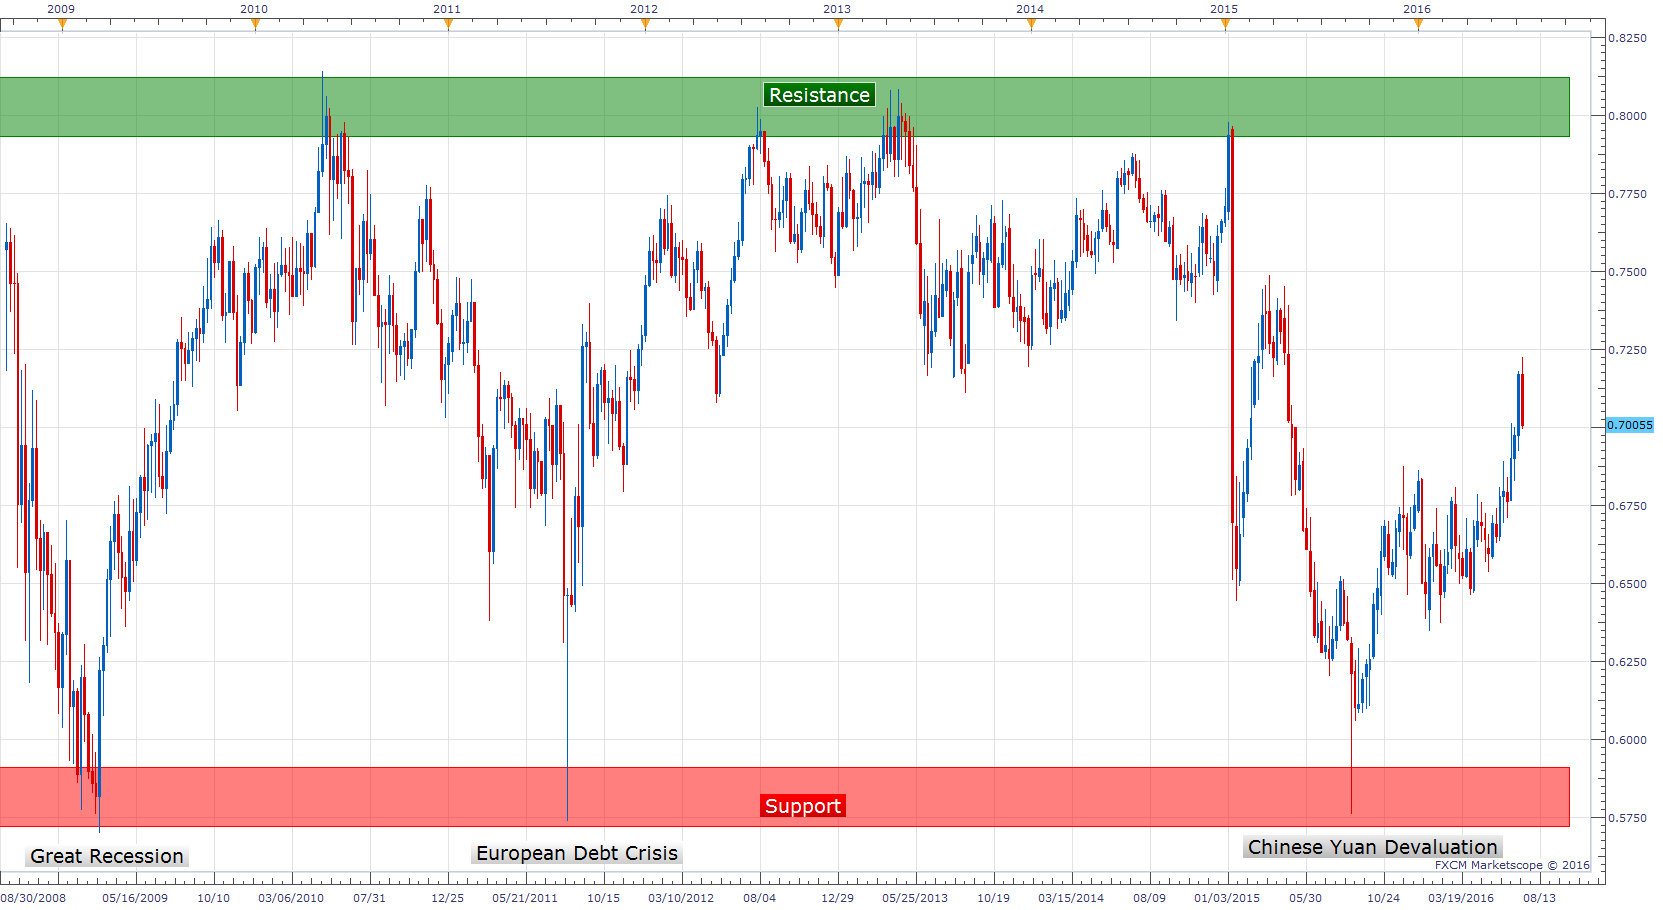
(Created Using Marketscope 2.0)
As observed in the chart above, during the last times of financial distress (Great Recession of 2008, European Debt Crisis of 2011, and 2015 Yuan Devaluation), CHF has gained great value against NZD. On the other side, when the global economy is feeling rampant, NZD has gained great value against CHF. Therefore, this has created a big range for the cross.
Bottom Line:
Even though the UK referendum surprised the global economy and this threw risk aversion back in the eye of investors, NZD/CHF has failed to react to it but this effect seems to be happening not only in this cross but stocks as well as indices are trading around all-time high levels. On a shorter time we are still on the wait for further downward pressure for the cross looking to validate its previous pattern on the stochastic oscillator.
As a contrary perspective, price action finally breaks the SSD upside trend line to the downside and starts putting into consideration further declines in the cross validating its nature as a risk on risk off indicator.
Are You Interested In Knowing Where Stocks Might Be Heading? Then CLICK HERE To Check Our Forecast On Equities.
-- Written by Quasar Elizundia


