


Talking Points:
- Sentiment describes how the majority of traders view a currency pair.
- The Speculative Sentiment Index from DailyFX tracks retail sentiment specifically.
- Downloadable Historical SSI is available to backtest its effectiveness.
When someone asks me what my favorite trading tool is, I quickly lead them to the Speculative Sentiment Index or SSI. The turning around of my Forex trading career from my first two years in the red to the profitable trader I am today I attribute to the SSI and its direction filtering ability. The best part is that it's free to use and DailyFX offers historical SSI for historical testing for free as well. Inside this article, I will explain what sentiment is and how we can download this data for testing our own strategies with this powerful filter.
What is Sentiment?
Sentiment is a description of how a person or a group of people feel about something specific. In the case of trading, it's going to describe the ratio of bulls vs. bears. It tells us how many people have long positions and how many people have short positions for a given instrument.
In the case of DailyFX's Speculative Sentiment Index, it gives us a comparison between how many retail Forex traders are currently long and short on each major pair. Why does this matter you ask? Because when the SSI moves to an extreme level, price usually moves in a predictable direction against the retail crowd. The USDCHF is a recent example of this phenomenon.
Back in February, USDCHF retail sentiment reached a 3-year high of +7, meaning there were 7 traders who were in a buy position in the USDCHF for every 1 trader that was in a sell position. This 7-to-1 ratio meant over 87% of the retail trading crowd were long this pair. Knowing this, we should have looked to Sell the USDCHF for three reasons:
- Statistics show that most retail traders lose money. So if most retail traders were buying USDCHF, it might have been best to take the opposite trade.
- If most people had already bought the USDCHF, there were not many people left that could join them. The sudden lack of new buyers could have meant the price would begin to fall.
- If price did start to move against this group of buyers, one by one they would have begun to get stopped out. These stop orders would have then pushed price lower hitting a greater number of stops and could have created a cascade of sell orders.
Learn Forex: USDCHF SSI is Still in Positive Territory
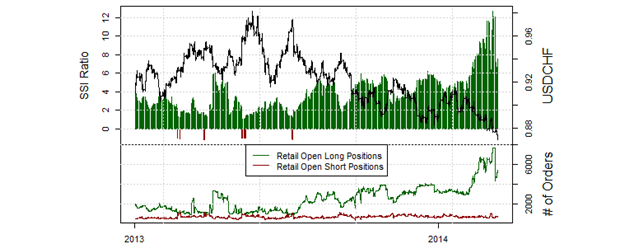
(Source: DailyFX's SSI)
Downloading Historical SSI Data For Testing
We should all understand how SSI works now. We find out what the retail crowd is trading and look for an opposing trade. But what if we want to analyze SSI's impact on price over a larger sample size? How can we know if using SSI as a filter will work for our own personal trading strategy? Luckily, DailyFX offers historical SSI data that we can use to semi-manually backtest strategy performance with and without SSI as filter. This allows us to directly assess its strength as a filter over a greater amount of time.
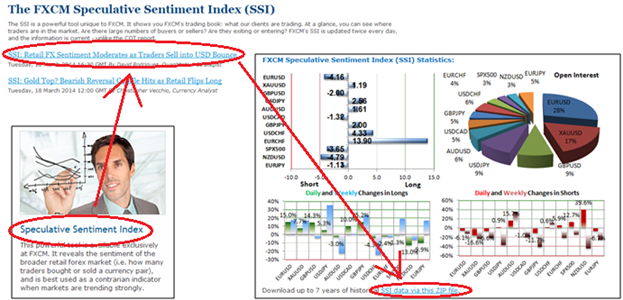
To access the data, we need to login to www.dailyfxplus.com using our FXCM account number and password or by subscribing for $19.99/month. Once we log in, we need to select "Speculative Sentiment Index", click the top (most recent) SSI submission, then click "SSI data via this ZIP file."
Learn Forex: Downloading Historical SSI Data
On Your Mark, Get Set, Backtest!
Now that we have this historical SSI data, we can look at our trading history to see what trades would have been filtered out by SSI and see if this filter would have been an improvement. Better still we can backtest new strategies by only allowing them to buy when SSI was negative and only allowing them to sell when the SSI was positive and see what affect it has.
My next article will feature just that, backtesting an ordinary strategy and comparing its trading results to the exact same strategy that uses the SSI as a filter. We will then be closer to definitively calculating SSI's strength.
Good trading!
---Written by Rob Pasche
New to Forex? Watch this introduction video.
Take this free 20 minute “New to FX” course presented by DailyFX Education. In the course, you will learn about the basics of a FOREX transaction, what leverage is, and how to determine an appropriate amount of leverage for your trading.
Register HERE to start your FOREX learning now!


