


- A Doji is a small bodied Japanese candlestick pattern whose opening and closing are at the same or nearly the same price.
- A Doji is usually part of common Japanese candlestick reversal patterns like the bullish Morning Star and bearish Evening star patterns
- Because Dojis are found in a large number of reversal patterns, traders automatically think that the single doji is a reversal candlestick. But in fact, the doji by itself represents indecision in the marketplace.
- A Doji breakout setup provides an excellent risk to reward opportunity for forex traders.
Learn Forex: Family of Dojis
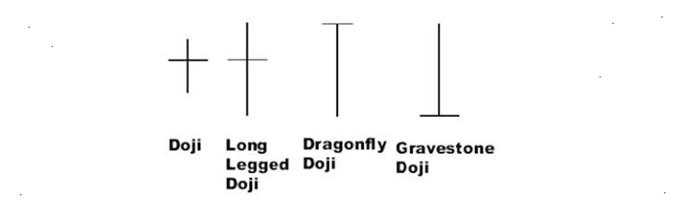
The lowly doji is very unassuming in appearance. Typically, it looks like a plus sign but can appear as a capital “T” in the Dragonfly doji pattern or the shape of a nail in the Gravestone Doji. We are going to be discussing the first two types of dojis found in the “cheat sheet” above. These small candles can lead to large breakouts that either continue trends or reverses them. We are going to look at the way to trade these power packed price patterns with limited risk for maximum potential gain
Learn Forex: How to Read a Japanese Candlestick
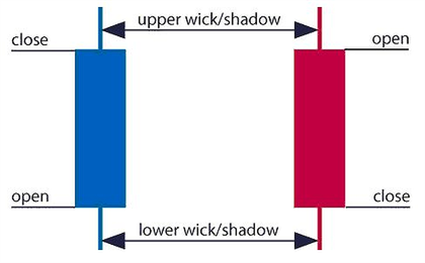
Typical candlesticks consist of a body that may be one of two colors; blue or red. A candle is blue if buyers were able to push prices above the opening price and were able to hold it until the close of the candle. A candle is red or bearish is sellers were able to push prices below the opening price and hold it there until the close.
Learn Forex: How to Read a Doji Candlestick
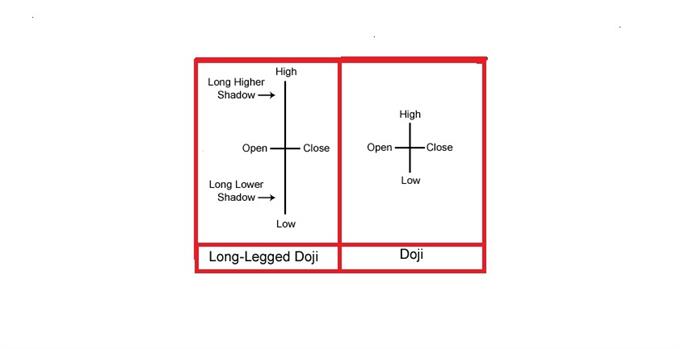
On the other hand, the doji candles have no color. The doji and long-legged doji illustrate the battle between buyers and sellers that ended in a tie. The opening price and closing price are in the same place as bulls were unable to close prices higher and bears were unable to close prices lower.
How to Trade the Doji Breakout
Ideally, you want to find a doji that has formed near a level of support like a trend line. You want to identify the doji high and the doji low as this will determine the support and resistance levels of a potential breakout.
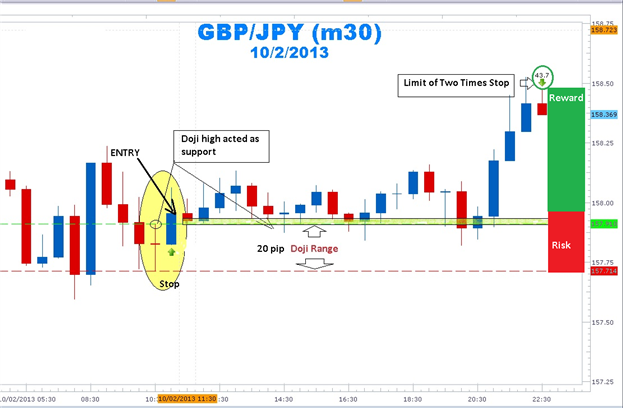
Learn Forex: GBP/JPY Doji Range Breakout Trade
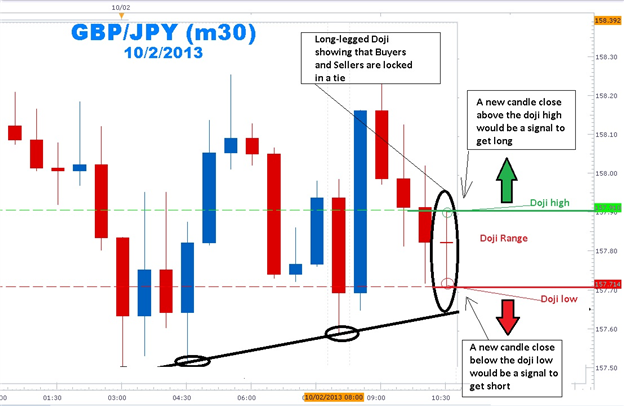
(Created using FXCM’s Marketscope 2.0 charts)
Next, you want to wait for a full-bodied candle to close either above the doji high or below the doji low. Since bulls and bears have been at a standstill, a high volatility breakout should happen releasing this pent up pressure. If you get a breakout below the doji low, place a protective stop about 4 pips above the doji high and enter short on the close of the breakout candle. Calculate the doji range and multiply that times two to get the limit. Since your stop is the range itself, you want to target double your initial risk.
Learn Forex: Managing Risk with the Doji
(Created using FXCM’s Marketscope 2.0 charts)
On the other hand, if a full-bodied candle closes above the doji high, enter long at the close of the candle and place a stop 4 pips below the low of the doji. That is your trigger to get long. In the example above, the doji range was 20 pips and twice the range gave me a target of 40 pips. Notice how significant the high of the doji was as it acted as support. It is important to note that some dojis during periods of low volatility, like those found in the Asia session, give many false signals.
So next time you see the doji on your forex charts, give the little fella some respect as it can tell you a lot about setting stops and limits for the next big breakout trade!
--- Written by Gregory McLeod, Trading Instructor
---To contact Gregory McLeod, email mailto:gmcleod@dailyfx.com. Follow me on Twitter @gregmcleodtradr.
I hope you learned how to spot breakout trades with the doji Japanese candlestick pattern as well as rules to trade doji breakouts. If you are new to candlestick charting or want to further your knowledge of candlestick patterns. Sign my guestbook to access a short 20 minute free tutorial Price Action Candlesticks by clicking here


