


Article Summary: Trading trends can be one of the most desireable market conditions when trading FX, as long-term deviations between economies can create elongated moves in which traders want to look to ‘buy low, and sell high.’ This article will go over a strategy that traders can use in these conditions.
As traders, knowing when to buy and sell is as, if not more important than any other decision that we will be faced with. A trading strategy and trading plan are of the upmost importance so that traders can hone their skills and build their approach towards the ultimate goal of profitability.
This strategy is designed for swing trading, that is with the anticipation of holding trades for anywhere from a few hours to a few days. The strategy is designed for trending market conditions, and can be optimal when markets are forming longer-term trends so that the strategy can allow us to enter multiple times buy ‘buying low, and selling high.’
The Chart Time Frames
Swing-Traders usually find comfort on the 4-hour chart, often called the ‘dealer chart.’ The 4-hour chart is important because it does a great job of breaking up trading sessions between represented geographies. For this strategy, the 4-hour chart is the only time frame needed, although we will reference longer timeframes for the formation of one of our indicators to take into account information from the Daily chart.
The Indicators
This strategy needs only 3 indicators, all of which can be plotted directly on our 4-hour chart. The chart below will show all three, and following is a description of each.
The Three Indicators Used in the Strategy
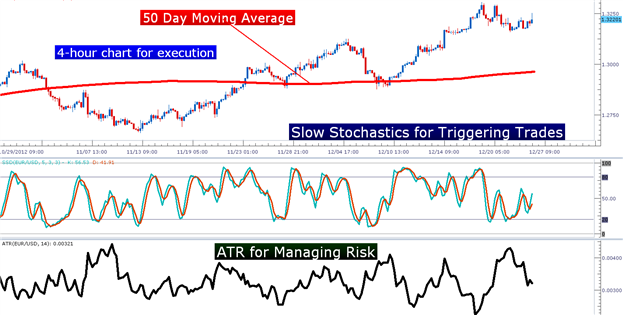
Created with Marketscope/Trading Station II
To grade trends, and to decide whether the strategy is buying or selling a moving average of 50 periods will be used. But we want this moving average to take in more information than just the last 50 4-hour bars, so we can set the indicator up to be built on data from the Daily chart.
We walked through the process to build indicators on longer time frames in the article, Building a Better Indicator. From the Trading Station platform, traders can do this by clicking on the tab for ‘data source,’ while in the indicator properties dialog box, and then toggling the drop-down next to ‘periods’ to ‘D1.’ This will build our 50 period Moving Average on the Daily Chart, so we will be looking at the 50-Day Moving Average.
The next indicator to be added is what we will use to trigger positions; and this is where Stochastics come in. The indicator in this strategy is a slow stochastic with inputs of 15,3, and 3. This will be build and executed from the 4-hour chart, so no changes are needed in the ‘data sources’ box of the indicator.
The third and final indicator in the strategy is Average True Range, or ATR, which can be used for the setting of stops and profit targets. This will also be built and executed from the default, 4-hour time frame.
The Strategy
The strategy is based around the concept of trading in the direction of the trend with the same logic that’s been taught to us since we were children: Buy low, and sell high.
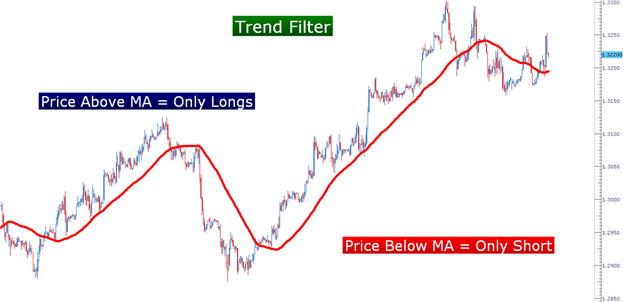
The first part of the strategy involves identifying the trend; and quite simply, if price is residing above our 50-day moving average, then the trend is qualified as to be ‘up.’ And on the opposite side, if prices are below the 50-day moving average - per the strategy the trend is classified as being ‘down.’
Using the 50 Period Daily Moving Average as Trend Filter
Once the trend has been identified, the trader can then look for appropriate entries. In the case of up-trends, the trader wants to look to buy - and wants to only look for BULLISH stochastic crossovers, provided that the crossover occurs below the ‘50’ line on the indicator. When %K crosses up and over %D, that is a bullish signal to enter, and once the candle in which the crossover takes place closes - thereby confirming the crossover, the trader can enter into the position. The picture below will further illustrate bullish stochastic crossovers:
Bullish Stochastic Crossover Under the ’50’ line

Created with Marketscope/Trading Station II
If the trend is classified as being down, with prices below the 50-day moving average, traders only want to investigate sell positions; and in this case would only be looking for BEARISH stochastic crossovers. Once %K crosses DOWN and UNDER %D, provided the crossover is taking place above the ‘50’ line, the trader can look for the close of the crossover candle to confirm that the crossover has taken place, and then trigger into the short position. The picture below will illustrate Bearish crossovers:
Bearish Stochastic Crossover Over the ‘50’ line

Created with Marketscope/Trading Station II
Once positions have been entered, stops and limits should be placed appropriately. The Stop for the trade is the value of the 4-hour Average True Range reading. As usual with Average True Range, the value of the indicator is displayed in the format of the currency pair, giving it a slight learning curve. The picture below will illustrate further:

Created with Marketscope/Trading Station II
We talked about this in our article, Managing Risk with ATR (Average True Range), and you can certainly learn more from the link if so interested.
The Exit
There are multiple ways of exiting with the strategy, and the trader can choose which will work best for them based on their goals.
The first possible exit is by using a limit. This can be done by setting a limit at 2 times the value of ATR, or two times the value of the stop amount. In this mannerism, traders can simplistically look for a 1:2 risk-to-reward ratio.
The second alternative is to wait for an opposing crossover on Stochastics. If in a long position, and Stochastics crosses over in a BEARISH direction, the trader can look to close the position manually, with the expectation of being able to re-enter to the long side if the strategy allows. Or, of course, in a short position, traders would want to look for BULLISH crossovers in order to buy to close their short position.
--- Written by James Stanley
You can follow James on Twitter @JStanleyFX.
To join James Stanley’s distribution list, please click here.


