


The objective of this article is to show you how to download and use the “Show Time to End” indicator on the Marketscope charts. This tool will show you exactly how much time is left before the current candle closes on any time frame chart. The benefit provided by this indicator to the trader is twofold: 1) they will not have to figure out when the candle opened to determine how long before it closes, and 2) they will be able to know when to come back to check on the status of the closed candle.
It is a simple tool that makes the trader’s life a bit easier.
Let’s take a look at the chart below for an example of how I use this trading tool…
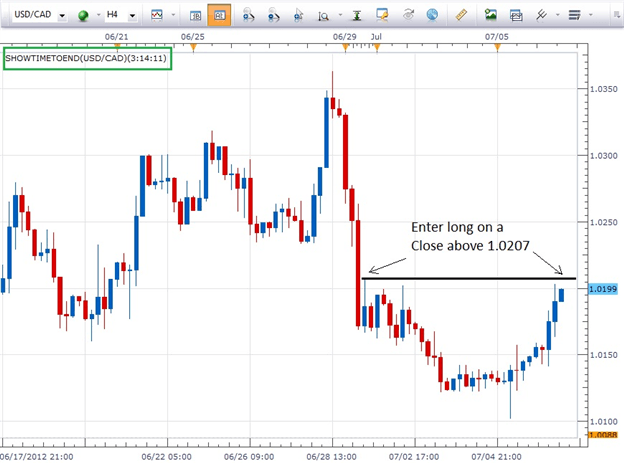
The bias on this USDCAD pair is bullish so I want to look for buying opportunities. Using this 4 hour chart, my entry would be when price closes above 1.0207. The current open candle, the last one on the right, is approaching that level and may close above it. But how do I know when to check back to see where the candle closed?

This is where the Show Time to End indicator is a big help!
Rather than having to figure out when the current 4 hour candle opened and then adding 4 hours to that time to determine the closing time, I can just check the indicator.
In the upper left hand corner of the chart, framed in green, I can see that the current candle will close in 3 hours, 14 minutes and 11 seconds. I now know when to return to my computer to check on the status of the candle. If price closed above the resistance level in question, I can enter. If it did not, I know when to check back again.
Another nice feature of this tool is that no matter what time frame I change the chart to, the Show Time to End indicator will make the adjustment.
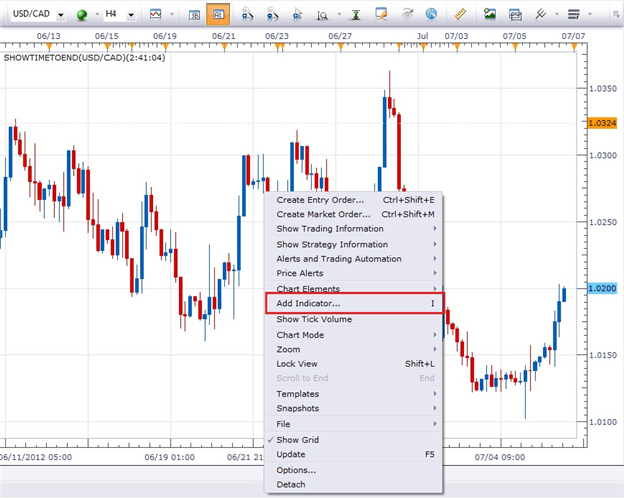
Here is the procedure to put this indicator on your Marketscope charts.
Right click any place on the chart and then left click on Add Indicator…
Next, scroll down to the bottom of the Add Indicator window until you see the “Other” category. Then, left click on Show Time to End…
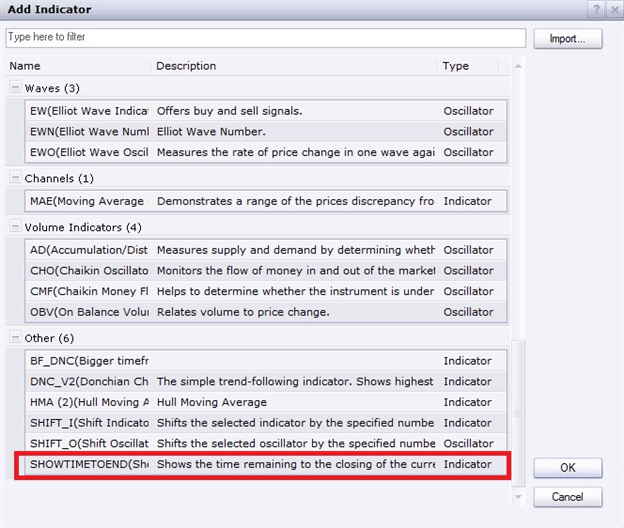
Then click OK and then click OK again and you will have this handy tool installed on your chart.


