


Since no one has that magical crystal ball that is going to tell us how a currency pair is going to move going forward, all traders use charts to make their trading analyses. The value of charts is that they show us the history of how a pair has moved over time. This history, for example, can show us price levels that the pair had trouble moving up through (resistance) or down through (support). Information such as this is invaluable when determining such things as our entries along with where to place our stops and limits.
When traders however become too granular when viewing their charts and they expand them to the point that they may only be viewing a few dozen or so candles, they lose one of the primary benefits that the chart provides: the big picture.
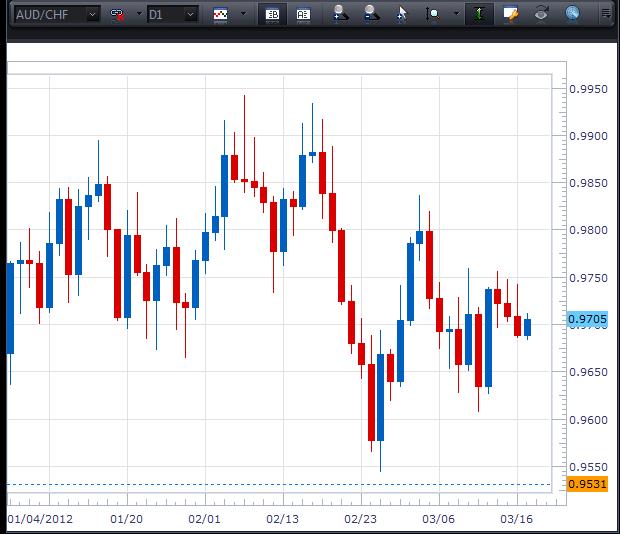
Let's take a look at these two views of the AUDCHF Daily chart below...
On the first chart we are looking at 54 trading days of information. Based solely on this amount of data, if you tried to determine the trend on the pair so that you knew if the pair had a bullish bias or a bearish bias to it, what would your answer be? I don't know about you, but I would be hard pressed to come up with a direction that I could technically justify.
The second chart on the other hand has roughly one year's worth of trading data on it as opposed to 54 days. Looking at the "big picture" regarding this AUDCHF currency pair, there is no question about which way this pair has been moving since about the middle of August of 2011. Based on this information we would want to look for buying opportunities on this pair.
Seeing how a pair has been moving over the longer term and with a "full view" can definitely resolve some questions.
Once the longer term charts have been checked out in an expanded view and the trend has been determined, then and only then is it OK to "get granular" and check out the shorter time frames and "expand the view" of all the charts for more detail if needed. The shorter time frames and the expanded chart views on their own, without getting the bigger picture, can oftentimes be misleading.

Here is a general breakdown on how far back a trader should look on some of the more popular trading time frames to obtain a good "feel" for how the pair has been moving...
15 Minute Chart: 3 - 5 Trading Days
30 and 60 Minute Charts: 2 Weeks
4 Hour Chart: 4 - 6 Weeks
Daily Chart: 1 Year


