


Price Channels: How to Trade with Price Channels
When Price Channels are placed on a chart, they identify the high and the low price at which the pair traded over a specified period of time. The Channels on the Daily chart below are set to 20 periods so they represent the high and the low at which the pair traded over the previous 20 days.
As such, they can be used quite effectively to visually identify levels of Support and Resistance on a chart. Also, the channels are often used by “breakout” traders to identify entry levels.
Take a look at the example below of Price Channels on a chart…
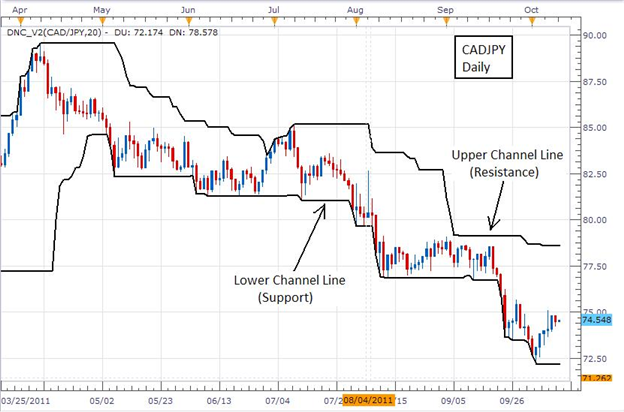
The lower channel line represents support while the upper channel line represents resistance.
As mentioned above, these channels can be put to good use by traders who employ a “breakout” trading strategy.
A breakout strategy consists of buying a pair that breaks above resistance in an uptrend or selling a pair that breaks below support in a downtrend. Since the price traded above the previous high or below the previous low, the pair is said to have “broken out” beyond its previous levels. When the breakout occurs, this can be taken as an entry signal as the potential exists for price to continue to move in that direction for a period of time.
Another effective way that the channels can be used is to identify a strong uptrend or downtrend. For example, take note of the red candles in the lower right hand corner of the chart. As they are “hugging” the lower channel line as they move lower, we have another visual cue that price is moving lower. If the candles were hugging the upper channel line in the same fashion, we would be using the channels to identify an uptrend.
Additional Resources:


