


Student’s Question:I am still on not clear on how old support becomes new resistance or vice versa. Help!Instructor’s Response:Good question…
Take a look at the chart of the EURUSD below…
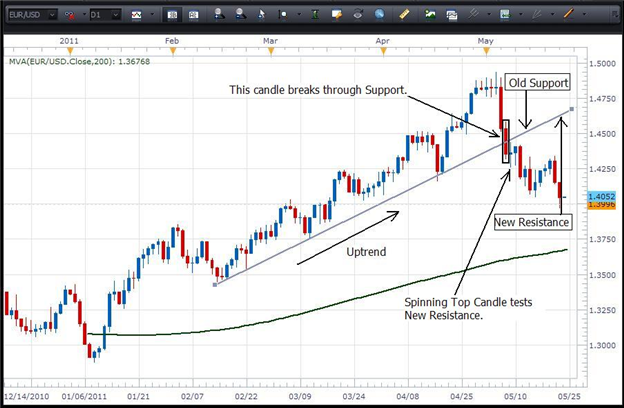
The gray line is a trendline showing support which has been in place since the middle of February. However, where price action breaks through that trendline (noted on the chart) and several candles close below that trendline, the line no longer represents support since price has convincingly broken through it.
Now, after the red candle closed below old support (noted on the chart), price action comes back up to test the former support line (blue spinning top candle) which now represents new resistance. Price action will test the new resistance line to see if it holds. The spinning top candle tests the new resistance line and does not penetrate it.
A way that a trader can use this concept would be by shorting the pair as new resistance is tested and respected by price action. In other words, a candle body does not close above the level that is now trendline resistance. When taking that trade, the stop would be placed just above trendline resistance or just above the highest wick that penetrated that resistance level.
The opposite would be true if we were in a downtrend and we had a resistance line above price action which kept being tested from below. It would represent resistance and when it was broken through by price action, it would then be new support.


