


Talking Points
-Bearish 3rd wave of 3rd wave Elliott Wave Count
-Bullish ‘B’ wave Elliott Wave Count
-How to determine which one is the preferred count
According to Elliott Wave Theory, the 3rd wave is typically the one trader’s seek out and focus on for timing trades. The 3rd wave of an 8 wave Elliott sequence (5 in the trend’s direction and 3 countertrend) is where the trader is aligned in the trend’s direction and has a large portion of the move left. Therefore, it offers traders an excellent risk to reward ratio opportunity.
(Click on the chart to zoom in; after zooming in, press the play button towards the right to set the market in motion)
Today, we will unpack a potential bearish 3rd wave set to unfold soon in the GBP/USD as well as a different bullish wave count that is valid as well. We’ll review both counts and discuss why my preference is for the bearish 3rd wave count.
Bearish 3rd Wave
This is the preferred wave picture for the GBP-USD is noted above. Red circle wave ‘ii’ ended on Aug 25 which means red circle wave ‘iii’ is in the early stages of a sell off and should divide into 5 waves lower.
It appears the first of those 5 waves lower finished forming on Sept 4 which is labeled as blue wave (i). Therefore, we appear to be working on wave (ii) higher that could terminate at any moment, but appears to have some unfinished business to take care of in the 1.55 handle.
This wave count becomes stressed on a move above 1.5650. That is the point where blue wave (ii) would be larger than red circle wave ‘ii’ in pips. There are not any Elliott Wave rules which suggest this cannot happen. However, from a practical standpoint, blue wave (ii) is a smaller degree of trend and should therefore not greatly exceed the same wave at larger degree.
If this wave pattern plays out, it suggests much lower prices coming to 1.49 and possibly 1.35 on an extreme move.
Kristian Kerr of DailyFX also discusses the potential timing window coming later this week in his recent market cycle piece. The timing Kristian suggests lines up with Elliott Wave count for a 2nd wave high.
Suggested Reading: Price & Time GBP/USD Squeezes Higher – What Now? .
B Wave Correction

(To expand the chart above, click here.)
The bullish alternate view is that we have been stuck in a complex correction. The blue circle ‘b’ wave was a zig zag or flat and we could be in the beginning stages of this last circle ‘c’ wave higher. This pattern is difficult to time an entry on because the B wave has options and could extend lower to 1.49.
Additionally, with the alternate count being a potential 3rd wave of a 3rd wave lower, we don’t want to get caught on the wrong side of the market should this B wave alternate prove to be incorrect.
Why Bearish 3rd Wave is Preferred
As Elliott Wave technicians, we need to have alternate views at hand. So how do we distinguish a preferred count from an alternate count? Look for other readings through indicators or oscillators to tip the scales.
There are 3 items tipping the scales towards the 3rd wave bearish count.
- On Balance Volume (OBV) suggests heavy selling internally which is bearish
- SSI (Speculative Sentiment Index) is +1.75 which is a bearish signal
- Waves down have been in 5 sub-waves…waves up have been 3 subwaves which suggests the trend is trying to form lower
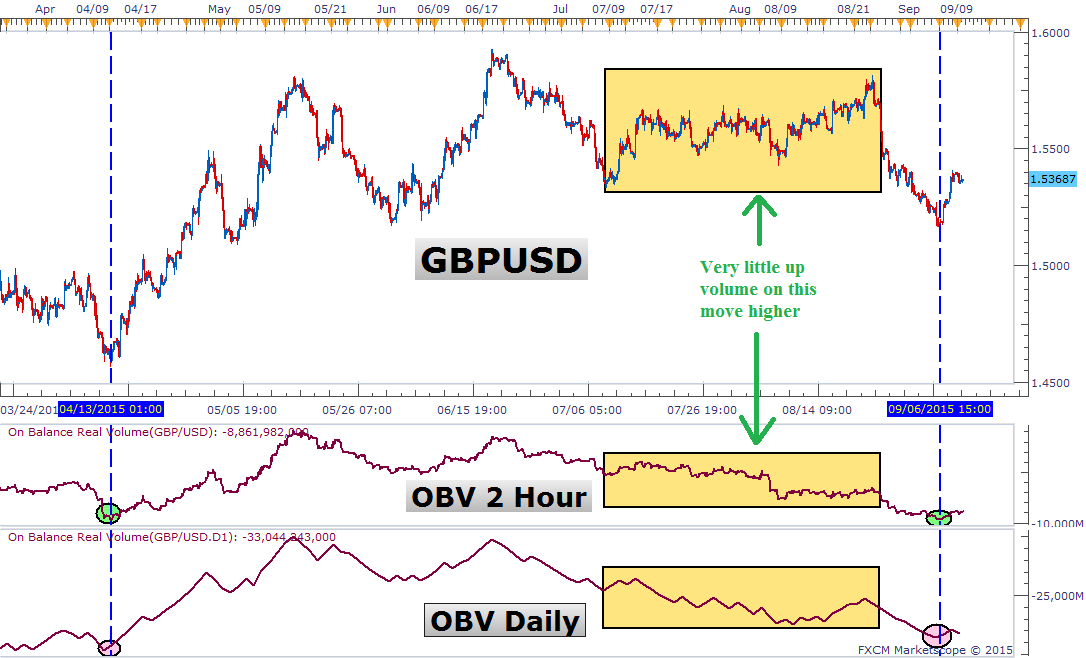
First, the OBV readings on both the daily chart and 2 hour chart are bearish. Notice how the OBV readings are near the lows seen in April 2015 yet price is at a significantly higher level relative to April. This is because the volume on the up move (yellow box) was light as prices were moving higher. Coincidentally, as prices dropped during the yellow box, it occurred on heavy volume. As a result, we get an OBV line that is pressing lows near April.
Suggested Reading: Finding On Balance Volume Trading Signals
Secondly, the sentiment readings gauged through the SSI are bearish. Currently, as of today, SSI shows +1.75 which means 64% of the traders are currently long the pair. These traders have already committed to their position and become a future supply of sellers when they decide to close their trade. Therefore, a +1.75 SSI reading is a bearish signal suggesting gains in the pair may be temporary.
Lastly, remember, R.N. Elliott discovered that five waves determine the direction of the trend. Therefore, if we map out the 3’s and 5’s, the only hint of 5 waves comes to the downside.
Just like when we look at only a couple pieces of a jig saw puzzle, we begin to see the picture but we don’t see everything. Therefore, the interpretation of what the image is on the jig saw puzzle could be incorrect. That analogy applies to trading as well.
Though these clues above give us insight as to what the picture may look like, it is probabilistic and not certain of the outcome. A move above 1.5650 will stress the 3rd wave count and lean us towards the bullish alternate.
Good luck!
Suggested Reading: GBPUSD & GBPJPY Are Breakout Candidates
---Written by Jeremy Wagner, Head Trading Instructor, DailyFX EDU
Follow me on Twitter at @JWagnerFXTrader .
See Jeremy’s recent articles at his DailyFX Forex Educators Bio Page.
This article uses Fibonacci ratios to follow a variety of patterns including Elliott Wave. To learn more about Fibonacci ratios, register to take this free 20 minute on demand course. Register here.


