


“Gold Won't Bottom Until the Faithful Are Washed Out”
-Jim Rogers, Legendary investor
Talking Points
- Gold & The US Dollar Have Recently Joined Forces In Directional Bias
- Ichimoku Shows that the Gold Correction From July & August May Be Over
- Price Targets on Ichimoku Gold Trade
Most often, traders who enjoy analyzing markets begin to venture into Intermarket analysis as a way to beef up their analytical skills. When studying relationships across different asset classes, there is one inverse relationship that most traders learn first. That is the inverse relationship between Gold & The US Dollar.
Learn Forex: US Dollar & Gold’s Inverse Relationship Has Temporarily Ended
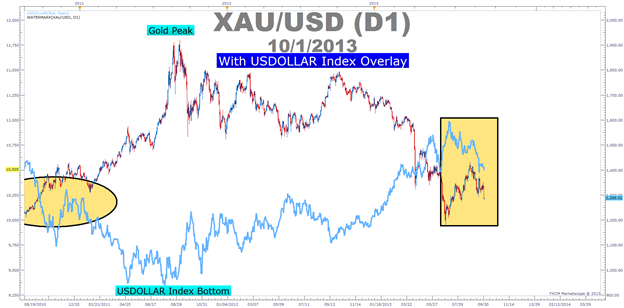
Presented by FXCM’s Marketscope Charts
The relationship between currencies and other markets likes stocks, bonds, & commodities is an indirect albeit very important relationship. In short, the dollar’s influence on commodities like Gold is due in large part to the fact that gold is priced in the US Dollar. Therefore, a falling dollar price pushes commodity prices higher most of the time.
As you can see on the chart above, we’re started to get a breakaway from the normal relationship as Gold has been moved lower with the dollar since late August. This is negative for gold in that the relationship is still expected to hold that when the US Dollar rises from the expected taper that Gold being priced in Dollars will drop in value. The other relationship that traders expect to hold up is that commodities will lead stocks and commodities of head in the same direction with commodities outlasting a bullish stock market. That relationship has also broken down with Gold.
Learn Forex: Stocks & Gold Are No Longer Treading In the Same Direction
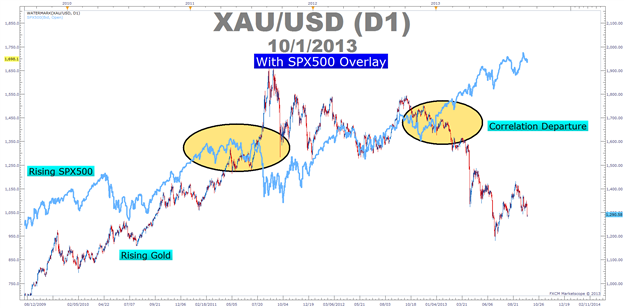
Presented by FXCM’s Marketscope Charts
As things currently stand, it appears from looking at the divergence of different asset classes that most available money is currently in stocks. This appears to show the Gold is no longer the attractive option in the current market and that you should likely look for Gold to continue moving lower given the currently view of the US Dollar moving lower as well as trend continuation of the SPX500 and other global stock markets.
Ichimoku Applied To the Current Gold Move
Ichimokuis a technical tool that can help you make sense of trends in the market. Gold has confused a lot of people as it slumped through the beginning of 2013, corrected a bit higher before slumping again this morning. A break below this morning’s lows on Gold of 1282 will have me looking at a re-entry to sell Gold as per Ichimoku’s lagging line breaking below the cloud which currently act as Gold’s last line of support.
Ichimoku Trade of the Week: A Break below 1282 Will Trigger an Ichimoku Sell Signal
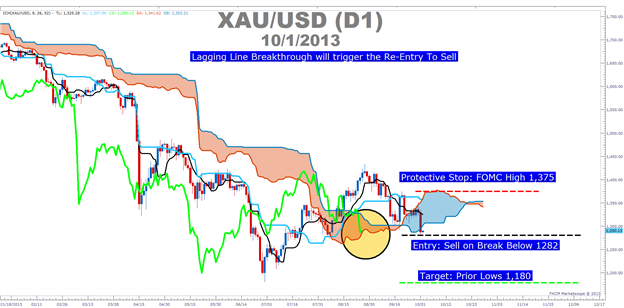
Presented by FXCM’s Marketscope Charts
Ichimoku Trade: Sell XAUUSD Based on Lagging Line Breaking Below Cloud
Stop: 1,375 (Price Action High post-FOMC Dollar Sell-Off)
Limit: 1,180 (June 2013 Low)
If this is your first reading of the Ichimoku report, here is a recap of the traditional rules for a sell trade:
-Price is below the Kumo Cloud
-The trigger line (black) is below the base line (light blue) or is crossing below
-Lagging line is below price action from 26 periods ago (bright green line)
-Kumo ahead of price is bearish and falling (red cloud = bearish Kumo)
-Entry price is not more than 300 pips away from base line as it will likely whip back to the line if we enter on an extended move.
Ichimoku is best used to spot good entries in the direction of a strong trend. On the chart above, XAUUSD’s trend has shifted from a potential buy trade on a potential reversal back into a trend resumption trade to the downside that we hope to catch with this trade. Because of the technical set-up and recent price action showing XAU weakness, we’re happy to consider this trade with the stop above the FOMC High of 1,373.
Happy Trading!
--Written by Tyler Yell, Trading Instructor
To contact Tyler, email tyell@dailyfx.com
To be added to Tyler’s e-mail distribution list, please click here.
Become a Smarter Trader Today
Claim your FREE universal membership to DailyFX Internet Courses & save yourself hours in figuring out what FOREX trading is all about.
You'll get this FREE 20 minute “New to FX” course presented by DailyFX Education. In the course, you will learn about the basics of a FOREX transaction, what leverage is, and how to determine an appropriate amount of leverage for your trading.
You can instantly register for free here to start your FOREX learning now!


