


Article Summary: Price action is the cleanest indicator in the world but it can be hard for many traders to read . Beyond price action there are indicators that help you see how the current price is acting in relation to the overall trend or range so you know if you’re looking at a high probability entry or not. By being sensitive to turning points, the Stochastic Momentum Index (SMI) can help you see what’s happening now and help you see what probable outcomes may be next.
Oscillators are commonly known as overbought or oversold indictors. This can be helpful when you first see an oscillating indictor on the chart but in terms of trading success, looking at oscillators only in term of overbought or oversold alone can be dangerous. This article will expand your view on oscillators and introduce you to a new oscillator that can help you pinpoint and trade market turning points more effectively.
The Stochastic Momentum Index (SMI) was introduced by William Blau in 1993 as a way to clarify the traditional stochastic oscillator. SMI helps you see where the current close has taken place relative to the midpoint of the recent high to low range is based on price change in relation to the range of the price. This is a heavy way to start an article but important to know because if you know where price has closed in relation to the recent range or trend then you have a good idea if a turning point is upon you or if the current move still has room to run. By taking the range of historical prices, you have the ability to anticipate trend changes.
Learn Forex: Like Most Oscillators SMI is bound between 100 and -100

One thing you’ll quickly notice about the SMI is that it is much faster than the traditional stochastic so knowing how to read the indicator is key. You’ll see the default setting below and those are the ones we’ll stick with to find trading opportunities with this adaptable and effective indicator. However, you are able to “slow down” the indicator by increasing the periods over which the SMI is reading.
Three Ways to Trade This Indicator
Here are the more popular methods to use this indicator to find trading opportunities.
Overbought / Oversold Level Crossover
As stated earlier, if you’re not recognizing clear support and resistance showing you a range than blindly trading off overbought or oversold signals can be dangerous. It’s been said that markets can trend far longer than you can stay solvent as a way to say trading against the defined trend is tough game to play. The popular overbought or oversold levels are +/- 40 on the indicator.
Learn Forex: Trading History On EURUSD Entering On Overbought / Oversold SMI Signals

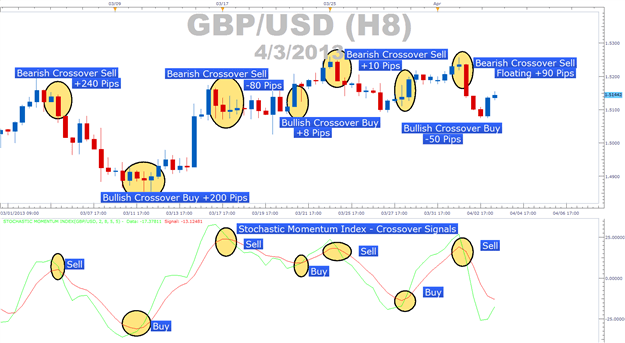
Signal Line Crossover
The signal line crossover will present many trades resulting in a lower win percentage (# of trade closed at a profit / total # of trades). However, there is a method you can use to filter out lower probability crossovers. The method would be adding a neutral zone to the indicator at the levels of +/- 15.
Learn Forex: Utilizing the Neutral Zone Can Help You Stay In Good Trades Longer

The way you can view this neutral zone will be filtered in the most recent trend you placed. Therefore, if you entered a buy trade based on a SMI crossover at -40 or less and then you notice a crossover in the +/- 15 neutral zone, you would not reverse the position but rather watch how the market reacts to relative support on the current move higher. If the market moves nicely through the neutral zone with the trend in tact then you can tighten your stops or add to your trade if you wish.
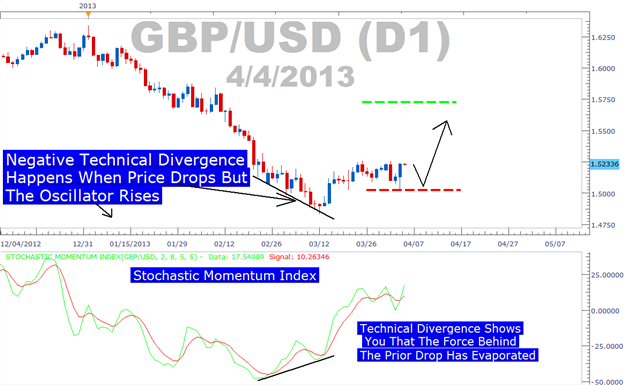
SMI Divergence
Technical divergence can happen on the buy or sell side of the chart. Divergence isn’t very common but that’s what makes for a more effective signal when generated. Divergence happens when prices are making higher highs and the SMI is not. This can happen on the sell side when price is making lower lows and the SMI is not which would give you an opposing buy signal when price breaks relative resistance.
Learn Forex: Technical Divergence Allows You To Enter A Trade After Opposing Forces Have Left
Closing Thoughts
You’ve been introduced to multiple methods of adding the SMI to your trading toolbox. Whether you’re taking trades off of extreme crossovers, simple signal line crossovers, or SMI divergence, the SMI can help you spot many opportunities that are not easily seen with price action alone. However, whatever tool you use, we always recommend to keep your trade size appropriate and in line with your overall risk management goals. At DailyFX we have conducted research on over 100 000 active IG client accounts to discover the Traits of Successful Traders
---Written by Tyler Yell, Trading Instructor
Interested In Our Analyst's Best Views On Major Markets? Check Out Our Free Trading Guides Here
Oscillator FAQs
Can I trade based on the SMI alone or are there other factors to consider?
Oscillators provide better signals when the market is trading in a channel. The strength of your signal may also be altered (strengthened or weakened) should the market be near key levels of support or resistance or near a key Fibonacci level. Probably the most undervalued resource available to traders is the IG client sentiment page that provides key insights into the direction traders are favouring. For more information on how to trade using client sentiment have a look at James Stanley's article, the Speculative Sentiment Index.


