


Talking Points
- The AUD/USD Consolidates After Yesterday’s FOMC Rate Decision
- Traders May Look for a Breakout Using the Previous Daily High and Low
- If you are looking for more trading ideas for the AUD/USD check out our Trading Guides
The AUD/USD has failed to make significant gains or losses after yesterday’s FOMC rate decision and policy statement. By not creating a new high or low during today’s session, the currency pair is consolidating by trading inside of yesterday’s daily candle. Current resistance for the AUD/USD may be found by using yesterday’s high at .7568 as a reference. Support may also be found using yesterday’s low at .7420. Traders should continue to monitor these values along with short-term momentum to plan for a breakout in the market.
AUD/USD, Daily Chart
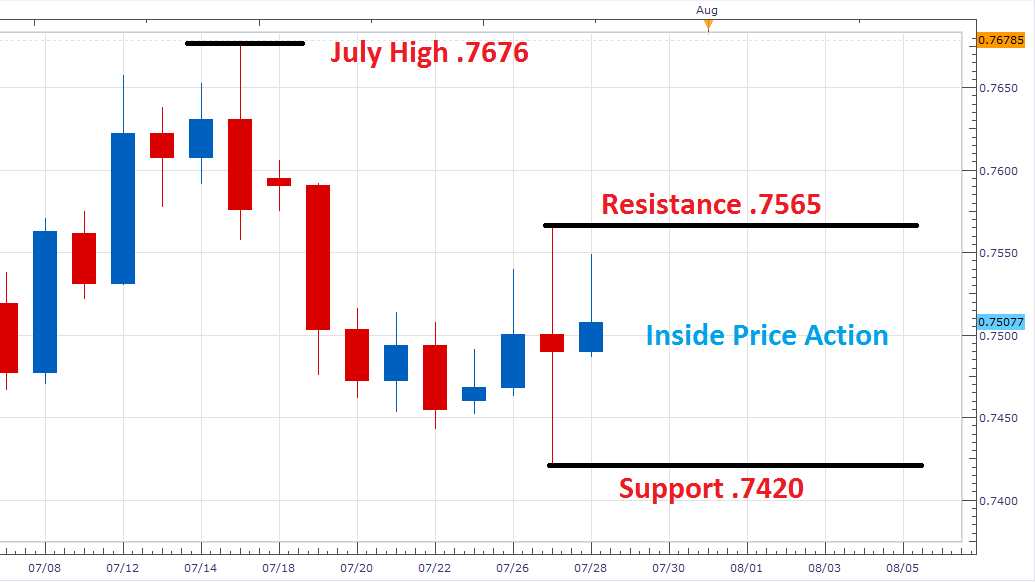
(Created by Walker England)
In the 5-minute graph below, we can see the AUD/USD slowly moving off of the daily high at .7549. The Grid Sight Index has indicated that short-term momentum is also pointing lower by identifying a series of lower lows and lower highs being created over the last hour. After reviewing 55,679,772 pricing points, GSI has indicated that price has risen a minimum of 12 pips in 50% of the 110 matching historical events. Alternatively, the Index has noted that prices have fallen 12 pips in 32% of these historical matches.
Typically, when these historical percentages fail to lean strongly in one direction, it is indicative of a consolidating market. In these scenarios, traders may watch both the final bullish and bearish distributions to help identify the markets chosen direction. The current final bearish distribution resides at .7465, and historically prices declined by 48 pips or more in just 5% of the identified 110 matching events. Alternatively, the last bullish distribution line is found at .7561. Prices rose by 48 in only 6% of the matching 110 historical events.
Want to learn more about GSI? Get started learning about the Index HERE.
AUD/USD 5 Minute GSI Chart

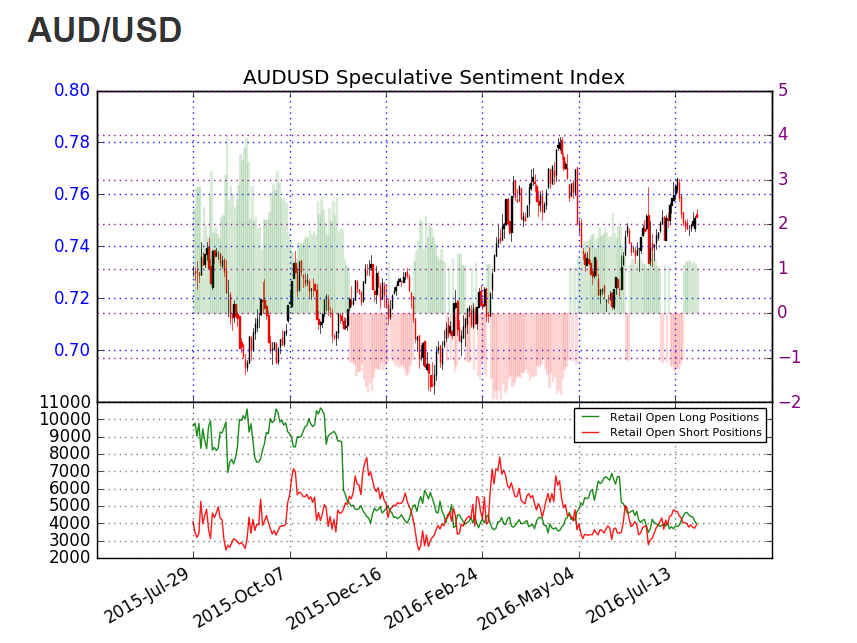
Sentiment for the AUD/USD relatively flat with SSI currently reading at +1.02. With 51% of positioning long and 49% short, this is indicative of a consolidating market. In the event of a bearish breakout, traders should look for SSI to move towards positive extremes of +2.0 or greater. Alternatively, if prices breakout higher, it would be expected to see SSI reading flip towards a negative extreme.
To Receive Walkers’ analysis directly via email, please SIGN UP HERE
See Walker’s most recent articles at his Bio Page.
Contact and Follow Walker on Twitter @WEnglandFX.


