


Talking Points:
- Value of Candlestick Reading
- USDJPY Bearish Pattern
- Key Focal Levels on USDJPY
“Step after step the latter is ascended”
-Japanese Proverb
For real-time market sentiment based on price alone, many experienced traders turn to Japanese candlesticks. Candlesticks are easy to understand and can alert you to shifts in market sentiment in real-time. This real-time analysis has many benefits over lagging indicators like moving averages or oscillators.
Value of Candlestick Reading
In fact, a recent article I wrote about stocks being heavy was based on a weekly candlestick pattern. That candlestick pattern was a toping formation known as a shooting star which means that bullish sentiment couldn’t hold higher prices. Since the top of that pattern, SPX500 had dropped 75 points and could be on its way to retesting the 2014 lows of 1737 or more. The low developed off a candlestick pattern known as a hammer bottom shown below.
Learn Forex: Candlesticks Can Provide Invaluable Real-Time Analysis

The chart above is on the weekly chart. However, the candlestick approach works on all time frames. Short-term traders will often look for similar patterns on hourly charts that position or swing traders will look for on daily or weekly charts. Within the Shooting Star on the weekly SPX500 chart, you can see bearish engulfing candles on the Daily SPX500 chart.
Learn Forex: Bearish Engulfing Means That Buyers Were Absent in the SPX500 Drop

USDJPY Bearish Pattern
You may be asking what these examples have to do with a warning on buying low in USDJPY. Simply put, there are a handful of warning signals in other markets that are significantly well to the USDJPY. However, one thing makes the USDJPY pattern unique and that is the number of candles involved.
Learn Forex: Bearish 3 Continuation Pattern on USDJPY

The significance of a candlestick pattern often relates to the number of candles involved. The Bearish Three Falling Method involves 5 distinct candles with a move back in the direction of the prevailing trend making it a high conviction trend continuation pattern. The key components of the Bearish Three Falling method is in the large bearish candle kicking off the move followed by three weak counter trend candles. Then a large bearish candle that closes near the lows resumes the prior pattern to a bearish move.
Key Levels on USDJPY
While the pattern is clear, there is still support that would ideally need to break before a trade is risked. The double-bottom low of 101.20 currently provides a lot of support and as you can see from the chart above, that is the low of the pattern and therefore needs to break before a trigger is given. Below 101.20, you should keep an eye on the 2014 low of 100.747 as buyers may jump in there to try and push up this multi-year trend before risking a move down to the upper 90’s.
Learn Forex: Key Levels on USDJPY Moving Forward
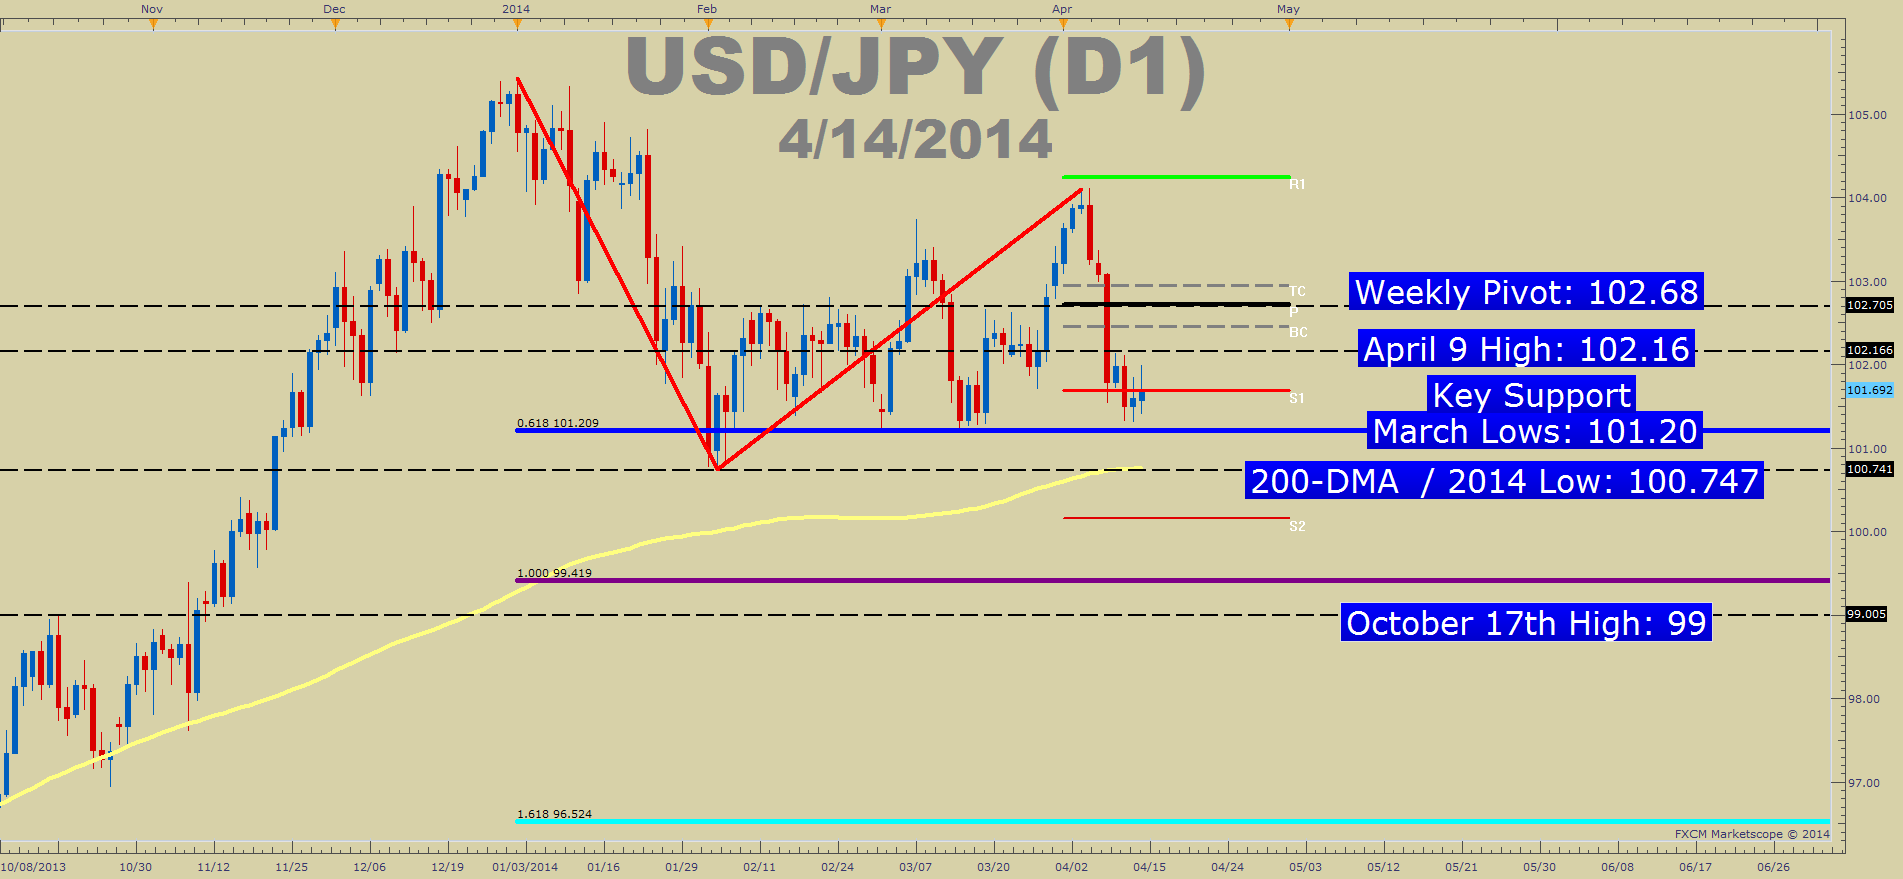
The chart above should help you see a few key inflection points on the USDJPY chart. Of the most important, you should focus on the weekly pivot as resistance near 102.70 and 101.20 as support. 101.20 has been singled out because that was the low at the start of the pattern and should 101.20 break, that would be the official continuation point to the 2014 low of 100.74 or the 100% expansion of the first down-leg to 99.44.
Closing Thoughts
Today’s article helped you see the value of candlestick analysis as well as a real-time example with USDJPY. You were also recently introduced to an Elliott Wave interpretation to USDJPY in a recent article.
Happy Trading!
---Written by Tyler Yell, Trading Instructor
Tyler is available on Twitter @ForexYell
To be added to Tyler’s e-mail distribution list, please click here.
Add me to your Google+ Forex Circle
Are you new to the FX market? Learn to trade like a professional with DailyFX!
Signup for this free “Trade like a Professional” certificate course to help you get up to speed on Forex market basics.
You can master the material all while earning your completion certificate.
Register HERE to start your Forex learning now!


